Quartile Calculator
Find the quartiles of any data set. Paste your numbers to see Q1, the median, Q3 and the interquartile range, plus the five-number summary and any outliers.
Formula: sort the data, then take the median for Q2. Q1 is the median of the lower half and Q3 is the median of the upper half, with the median left out of both halves when the count is odd. IQR = Q3 - Q1.

Formulas verified against standard references. Calculator logic tested with verified worked examples. Published: November 11, 2026 | Last updated: November 11, 2026. Fact-checked: November 11, 2026. Our methodology
How to Use the Quartile Calculator
Paste your numbers and the calculator sorts them, splits them into quarters and reports Q1, the median, Q3 and the IQR. It also flags outliers when you ask it to.
- Enter your data values, separated by commas or spaces. You need at least 4 numbers.
- Leave the outlier box ticked to flag values beyond the 1.5 x IQR fences.
- Optional: enter a value to check, and the calculator tells you which quarter it falls in.
- Press Calculate, or press Enter. The IQR appears first and large, with Q1, the median and Q3 below, then the five-number summary and the step by step working.
The Quartile Formula
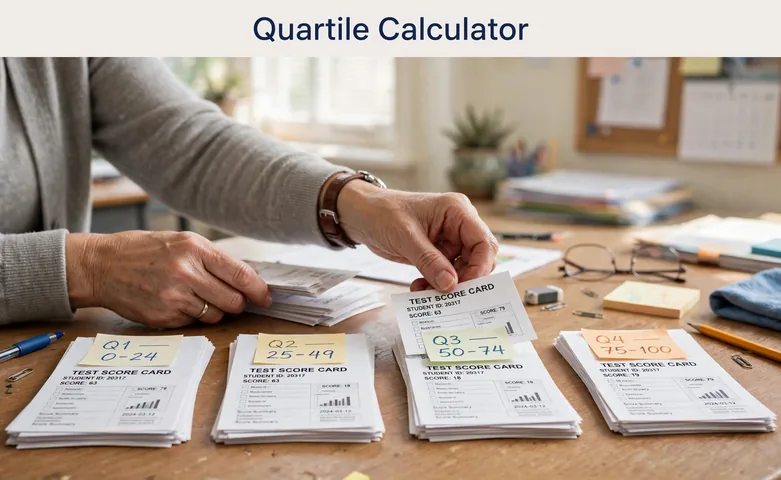
Quartiles split sorted data into four equal parts. Q1 marks the 25 percent point, Q2 is the median at 50 percent, and Q3 marks the 75 percent point. The interquartile range is IQR = Q3 - Q1, and it measures the width of the middle 50 percent of the data.
This calculator uses the exclusive method, also called Tukey hinges. Sort the data and find the median for Q2. When the count is odd, leave the median out of both halves. Q1 is the median of the lower half and Q3 is the median of the upper half. When the count is even, split the data in half and take the median of each half. Our mean, median and mode calculator finds the center of a data set the same way.
Worked Example: Eleven Test Scores
Eleven test scores are 52, 61, 64, 68, 70, 73, 75, 79, 83, 88, 97. Here is exactly what the calculator does.
- Sort the data. The scores are already in order, from 52 to 97.
- Find the median. With 11 values the middle one is the 6th, so Q2 = 73.
- Find Q1. Leave the median out. The lower half is 52, 61, 64, 68, 70, and its middle value is 64.
- Find Q3. The upper half is 75, 79, 83, 88, 97, and its middle value is 83.
- Find the IQR. 83 - 64 = 19. The middle 50 percent of the scores spans 19 points.
- Check for outliers. The fences are 64 - 1.5 x 19 = 35.5 and 83 + 1.5 x 19 = 111.5. No score sits outside them, so there are no outliers.
As a second check, take 12, 15, 18, 21, 24, 27, 30, 33. With 8 values the median is (21 + 24) / 2 = 22.5, Q1 is (15 + 18) / 2 = 16.5, Q3 is (27 + 30) / 2 = 28.5, and the IQR is 12. The same steps work for any data set, so try your own numbers in the tool above.
Why Quartile Calculators Sometimes Disagree
Quartiles have no single agreed formula. At least twelve methods exist, and textbooks, calculators and spreadsheets do not all use the same one. The exclusive method used here leaves the median out of both halves when the count is odd. The inclusive method keeps the median in both halves. Linear interpolation, the method behind Excel QUARTILE.INC, places Q1 and Q3 at fractional positions between values.
On the eleven test scores above, the exclusive method gives Q1 64 and Q3 83. The inclusive method gives Q1 66 and Q3 81, because the median 73 joins both halves. The IQR changes from 19 to 15. Neither answer is wrong. Each follows its own rule, and the difference comes only from how the halves are formed.
To compare results fairly, check which method the other tool uses. Excel QUARTILE.EXC matches the exclusive method on this page. Excel QUARTILE.INC and Google Sheets use interpolation. State the method next to the answer whenever you report quartiles, so a reader can reproduce your numbers.
How to Read the IQR and the Outlier Fences
The IQR tells you how spread out the middle half of the data is. A small IQR means most values sit close together. A large IQR means the middle half spans a wide range. Unlike the full range, the IQR ignores the extremes, so one very high or very low value cannot move it much.
The outlier fences sit 1.5 x IQR below Q1 and above Q3. Any value outside the fences is flagged as an outlier. In the worked example the fences are 35.5 and 111.5, and the lowest score is 52, so nothing is flagged. In a second set, 10, 12, 14, 16, 18, 20, 22, 100, the fences are 1 and 33, so 100 is an outlier. That single value lifts the mean but leaves Q1, Q3 and the IQR almost untouched, which is why quartiles suit skewed data.
An outlier is a flag, not a verdict. Check whether the value is a typo, a measurement error or a real result before you drop it. Our standard deviation calculator shows the spread in a way that does react to outliers, so the two tools together give a fuller picture.
Quartiles and the Five-Number Summary
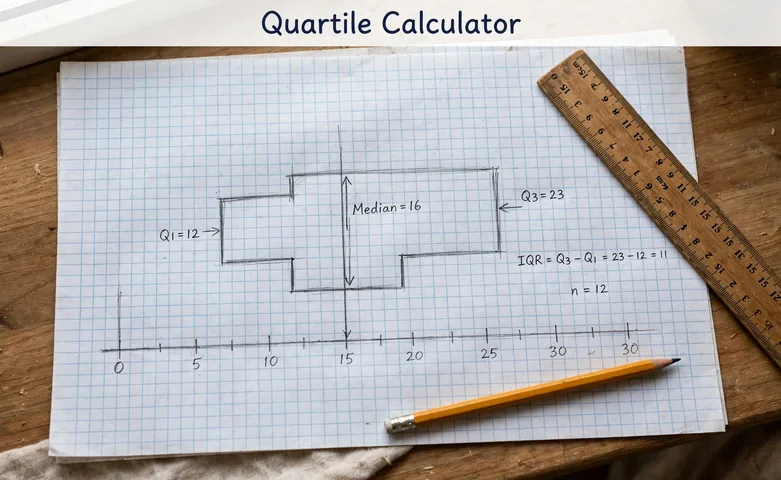
The five-number summary packs a data set into five values. They are the minimum, Q1, the median, Q3 and the maximum, in that order. For the eleven test scores the summary is 52, 64, 73, 83, 97. Those five numbers are enough to draw a box plot, which shows the shape of the data at a glance.
On a box plot the box runs from Q1 to Q3, with a line at the median. The whiskers reach to the smallest and largest values inside the fences, and outliers appear as separate dots. A box that sits high with a long upper whisker means the data skews high. A median line near one edge of the box means the middle half is lopsided. Our variance calculator and z-score calculator add two more ways to describe the same spread.

Frequently asked questions
How do you find Q1 and Q3?
Sort the data and find the median for Q2. Q1 is the median of the lower half and Q3 is the median of the upper half. This calculator uses the exclusive method, so the median is left out of both halves when the count is odd.
What is the IQR?
The IQR is Q3 minus Q1. It measures the width of the middle 50 percent of the data. For 52, 61, 64, 68, 70, 73, 75, 79, 83, 88, 97, the IQR is 83 - 64 = 19.
How do you find outliers with quartiles?
Find the fences at Q1 minus 1.5 x IQR and Q3 plus 1.5 x IQR. Any value outside the fences is an outlier. In the set 10, 12, 14, 16, 18, 20, 22, 100, the upper fence is 33, so 100 is an outlier.
Why does Excel give a different quartile?
Excel has two quartile functions that use different methods. QUARTILE.EXC matches the exclusive method on this page. QUARTILE.INC interpolates between values, so it can give slightly different answers on the same data.
How many numbers do you need for quartiles?
You need at least 4 numbers. With fewer values the halves are too small to give meaningful quartiles, so this calculator asks for 4 or more.
What is the five-number summary?
The five-number summary is the minimum, Q1, the median, Q3 and the maximum, in that order. For the eleven test scores it is 52, 64, 73, 83, 97. Those five numbers are enough to draw a box plot.
Related calculators

Mean Median Mode Calculator
Find the mean, median and mode of a data set.
Use calculatorStandard Deviation Calculator
Find the standard deviation of a data set.
Use calculatorVariance Calculator
Find the variance of a data set.
Use calculatorZ-Score Calculator
Find how many standard deviations a value is from the mean.
Use calculatorAverage Calculator
Find the average of a list of numbers.
Use calculatorProbability Calculator
Find the probability of an event.
Use calculator