Z-Score Calculator
Find how many standard deviations a value sits from the mean. Enter the value, the mean and the standard deviation to get the z-score, the percentile and the steps. Free, no sign-up, everything runs in your browser.
Formula: z = (x − Mean) ÷ Standard deviation. The percentile is read from the standard normal curve.

Formulas verified against standard references. Calculator logic tested with verified worked examples. Published: November 8, 2026 | Last updated: November 8, 2026. Fact-checked: November 8, 2026. Our methodology
How to Use the Z-Score Calculator
Getting an answer takes three quick steps. The tool turns a raw value into a standard score, so you can compare values that come from different tests or different groups.
- Enter the value you want to score in the first field. This is the raw score, such as a test mark of 85.
- Enter the mean of the group the value comes from, then the standard deviation of the same group.
- Press Calculate, or press Enter. The z-score appears first and large, with the percentile, the distance from the mean and the step-by-step math below. Press Reset to clear the form and start over.
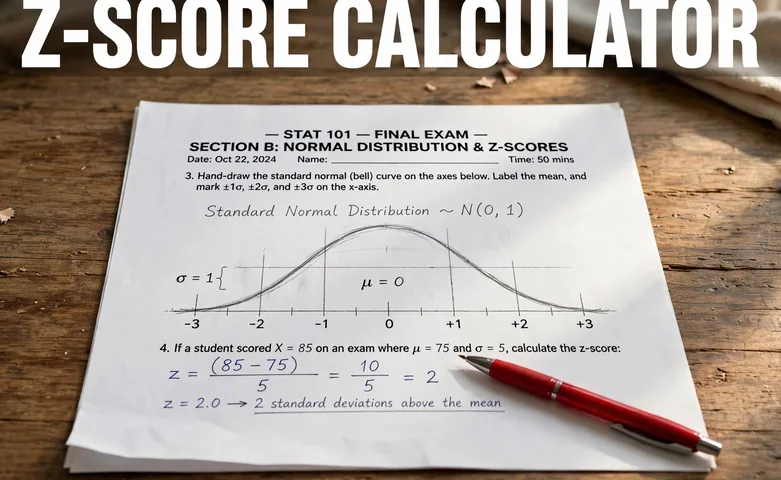
The Z-Score Formula
The z-score formula is z = (x − μ) ÷ σ. Each symbol means one thing, and all three inputs must come from the same group.
x is the value you want to score, such as one test mark. μ is the mean of the group, the average of all the values. σ is the standard deviation of the group, which measures how spread out the values are.
A z-score has no units, because the units cancel out in the division. A positive z-score means the value sits above the mean, a negative z-score means it sits below the mean, and a z-score of 0 means the value equals the mean exactly. The formula comes from the standard statistics definition taught in introductory courses, and it matches the formula used by the standard deviation calculator for the spread underneath it.
Worked Example: A Test Score of 85
A student scores 85 on a test. The class mean is 75 and the standard deviation is 10. Here is exactly what the calculator does.
- Subtract the mean: 85 − 75 = 10.
- Divide by the standard deviation: 10 ÷ 10 = 1.0.
- The z-score is 1.0, so the score sits one standard deviation above the mean. The matching percentile is 84.13, which means about 84 in 100 students scored at or below 85, if the scores follow a normal distribution.
As a second check, a score of 70 with the same mean and standard deviation gives z = (70 − 75) ÷ 10 = −0.5, the 30.85th percentile. The same steps work for any numbers, so try your own values in the tool above.

How to Read Your Z-Score
The z-score tells you where a value sits, and the percentile tells you how many values sit below it. The table below shows the landmarks most people use.
| Z-score | Percentile | Meaning |
|---|---|---|
| −2.0 | 2.28 | Two standard deviations below the mean |
| −1.0 | 15.87 | One standard deviation below the mean |
| 0 | 50.00 | Exactly at the mean |
| 1.0 | 84.13 | One standard deviation above the mean |
| 2.0 | 97.72 | Two standard deviations above the mean |
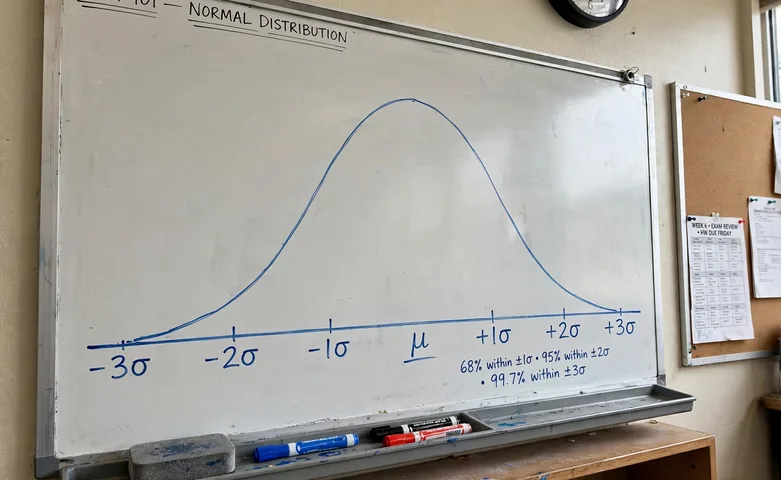
Most values fall between −3 and 3. About 68 in 100 values sit within one standard deviation of the mean, about 95 in 100 sit within two, and about 99.7 in 100 sit within three. A z-score beyond 3 in either direction is rare and worth a second look at the data.
Common Z-Score Mistakes
Dividing by the variance instead of the standard deviation is the most common error. The variance is the standard deviation squared, so dividing by it gives an answer that is off by a factor of the standard deviation itself. Always divide by the standard deviation.
Mixing up the mean and the standard deviation of two different groups is next. The value, the mean and the standard deviation must all describe the same group, or the z-score compares the value against the wrong average.
Using a sample standard deviation when the question needs a population one, or the other way round, changes the answer slightly. If your data is the whole group, use the population standard deviation. If it is a sample drawn from a larger group, say so and use the sample version. Our mean, median and mode calculator and average calculator help you find the mean first when you only have the raw numbers.
Z-Score vs Percentile
A z-score and a percentile answer different questions. The z-score says how far a value sits from the mean in standard deviation units. The percentile says what share of values sit at or below it.
The percentile only means what it says when the values follow a roughly normal distribution, the bell curve shape. The z-score itself needs no such assumption, since it is only a subtraction and a division. When the distribution is skewed, the z-score is still correct arithmetic, but the percentile can mislead, so read it as a guide rather than an exact count.
Use the z-score when you compare values from different groups, such as a test score against a class average and a sports result against a league average. Use the percentile when you want to say where someone ranks, such as the 84th percentile. Both numbers come from the same calculation, and this tool shows both at once.
Frequently asked questions
What is a z-score?
A z-score, also called a standard score, is the number of standard deviations a value sits from the mean of its group. It is found with z = (x minus the mean) divided by the standard deviation. A positive z-score means the value is above the mean, and a negative one means it is below.
How do I calculate a z-score?
Subtract the mean from the value, then divide the result by the standard deviation. For a value of 85, a mean of 75 and a standard deviation of 10, the z-score is (85 minus 75) divided by 10, which is 1.0.
What does a z-score of 1.5 mean?
It means the value sits 1.5 standard deviations above the mean. If the values follow a normal distribution, that is about the 93.32nd percentile, so about 93 in 100 values fall at or below it.
What is a good z-score?
There is no good or bad z-score on its own. A z-score near 0 means the value is typical for the group. A z-score near 2 means it is high, and a z-score near minus 2 means it is low. What counts as good depends on what you are measuring.
Can a z-score be negative?
Yes. A negative z-score means the value sits below the mean. A score of 70 with a mean of 75 and a standard deviation of 10 gives a z-score of minus 0.5, which is the 30.85th percentile.
What is the difference between a z-score and a percentile?
A z-score measures distance from the mean in standard deviation units, while a percentile measures rank, the share of values at or below yours. The percentile is read from the z-score and only holds exactly when the values follow a normal distribution.
Related calculators

Standard Deviation Calculator
Find how spread out a set of numbers is.
Use calculatorMean Median Mode Calculator
Find the mean, median and mode of any list.
Use calculatorAverage Calculator
Work out the average of a list of numbers.
Use calculatorProbability Calculator
Work out the chance of an event happening.
Use calculatorPercentage Calculator
Find what P% of any number is, instantly.
Use calculatorSummation Calculator
Add a list of numbers with the steps shown.
Use calculator