Standard Deviation Calculator: Sample & Population SD
Standard deviation measures how spread out a set of numbers is. Enter your data values, choose population or sample, and this standard deviation calculator returns both SDs, the variances, the mean, the sum and the count — with the formulas shown.
Formulas are standard statistical definitions. Calculator logic tested with verified worked examples. Last reviewed: October 2026. Our methodology
The standard deviation formulas
Standard deviation is the square root of variance: the average of the squared distances from the mean, un-squared back into the original units. The only difference between the two formulas is the denominator — N for a population, N − 1 for a sample.
- Population SD: σ = √( Σ(x − μ)² / N )
- Sample SD: s = √( Σ(x − x̄)² / (N − 1) )
- Population variance: σ² = Σ(x − μ)² / N
- Sample variance: s² = Σ(x − x̄)² / (N − 1)
Why squared differences? Squaring stops negative deviations cancelling positive ones — a value 3 below the mean and a value 3 above it would otherwise average to zero and falsely suggest no spread. Taking the square root at the end brings the answer back into the original units: dollars, points, seconds, not squared dollars.
Sources: standard statistical definitions — population SD σ = √(Σ(x−μ)²/N), sample SD s = √(Σ(x−x̄)²/(N−1)); see calculator.net’s standard deviation calculator and Khan Academy’s population vs sample standard deviation review.
Worked example
Take the dataset 2, 4, 4, 4, 5, 5, 7, 9 — the classic textbook example. The sum is 40 and the count is 8, so the mean is 40 ÷ 8 = 5. Subtract the mean from each value and square: (2−5)² = 9, (4−5)² = 1, (4−5)² = 1, (4−5)² = 1, (5−5)² = 0, (5−5)² = 0, (7−5)² = 4, (9−5)² = 16. The squared differences add to 32. Population variance = 32 ÷ 8 = 4, so population SD = √4 = 2. Sample variance = 32 ÷ 7 ≈ 4.5714, so sample SD ≈ 2.1381.
Population vs sample: which should you use?
The choice changes your answer, so it matters. Use population SD when your data is the entire group you care about — for example, all the quiz scores of one class. Use sample SD when you measured a subset and want to infer something about the larger group — for example, 100 voters polled to predict a whole city.
Population vs sample at a glance
| Population (σ) | Sample (s) | |
|---|---|---|
| Data covers | The whole group | A subset of a larger group |
| Denominator | N | N − 1 |
| Typical use | Complete small datasets | Surveys, experiments, inference |
| Example | All 8 quiz scores of a class | 8 voters polled from a city |
Why divide by N − 1?
The sample mean is computed from the same data it is meant to describe, which makes the squared deviations slightly too small on average — the data hugs its own mean. Dividing by N − 1 instead of N (Bessel’s correction) inflates the result just enough to remove that bias. For the same dataset the sample SD is always a touch larger than the population SD. In practice most real-world data is a sample, so s is the safer default.
How to calculate standard deviation by hand
Five steps, no shortcuts skipped. Follow them once on paper and the formulas above stop looking mysterious.
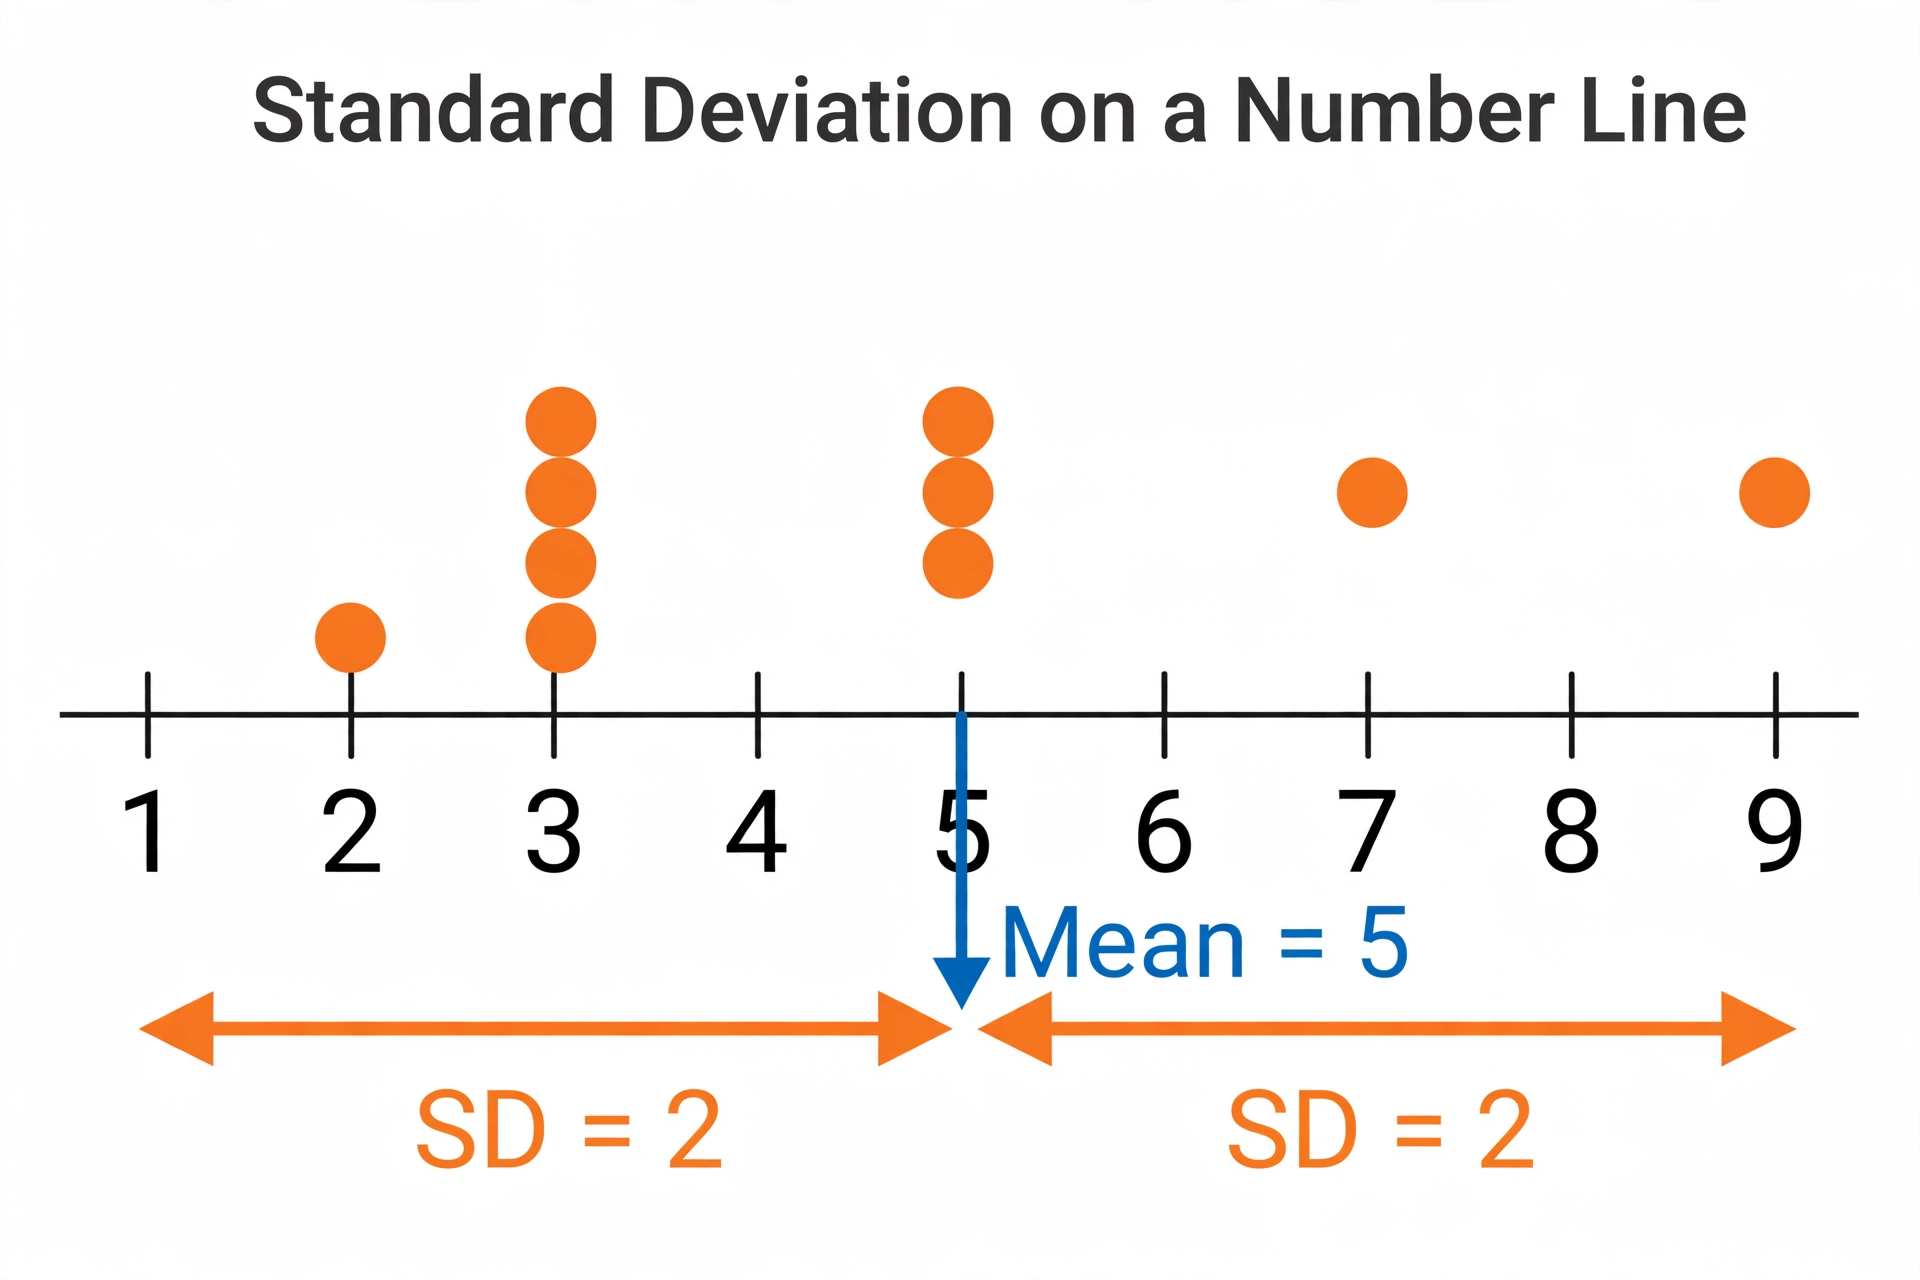
The five steps
| Step | What to do | Example (2, 4, 4, 4, 5, 5, 7, 9) |
|---|---|---|
| 1 | Add all values and divide by N to get the mean | Sum = 40, N = 8, mean = 5 |
| 2 | Subtract the mean from each value and square the result | 9, 1, 1, 1, 0, 0, 4, 16 |
| 3 | Add up the squared differences | 32 |
| 4 | Divide by N (population) or N − 1 (sample) — that is the variance | 32 ÷ 8 = 4 (population); 32 ÷ 7 ≈ 4.5714 (sample) |
| 5 | Take the square root — that is the standard deviation | √4 = 2 (population); √4.5714 ≈ 2.1381 (sample) |
Step 1 is just the average
Finding the mean is the same operation an average calculator performs — add the values, divide by the count. Everything after that measures how the individual values deviate from that centre. Watch step 4: it is the only place where population and sample differ, and the most common source of wrong answers.
Why standard deviation matters: the 68-95-99.7 rule
For data that forms a roughly bell-shaped (normal) curve, the SD turns into plain language: about 68% of values fall within 1 SD of the mean, about 95% within 2 SD, and about 99.7% within 3 SD. If test scores have mean 70 and SD 5, you know almost every student scored between 60 and 80 — no need to see the full list.
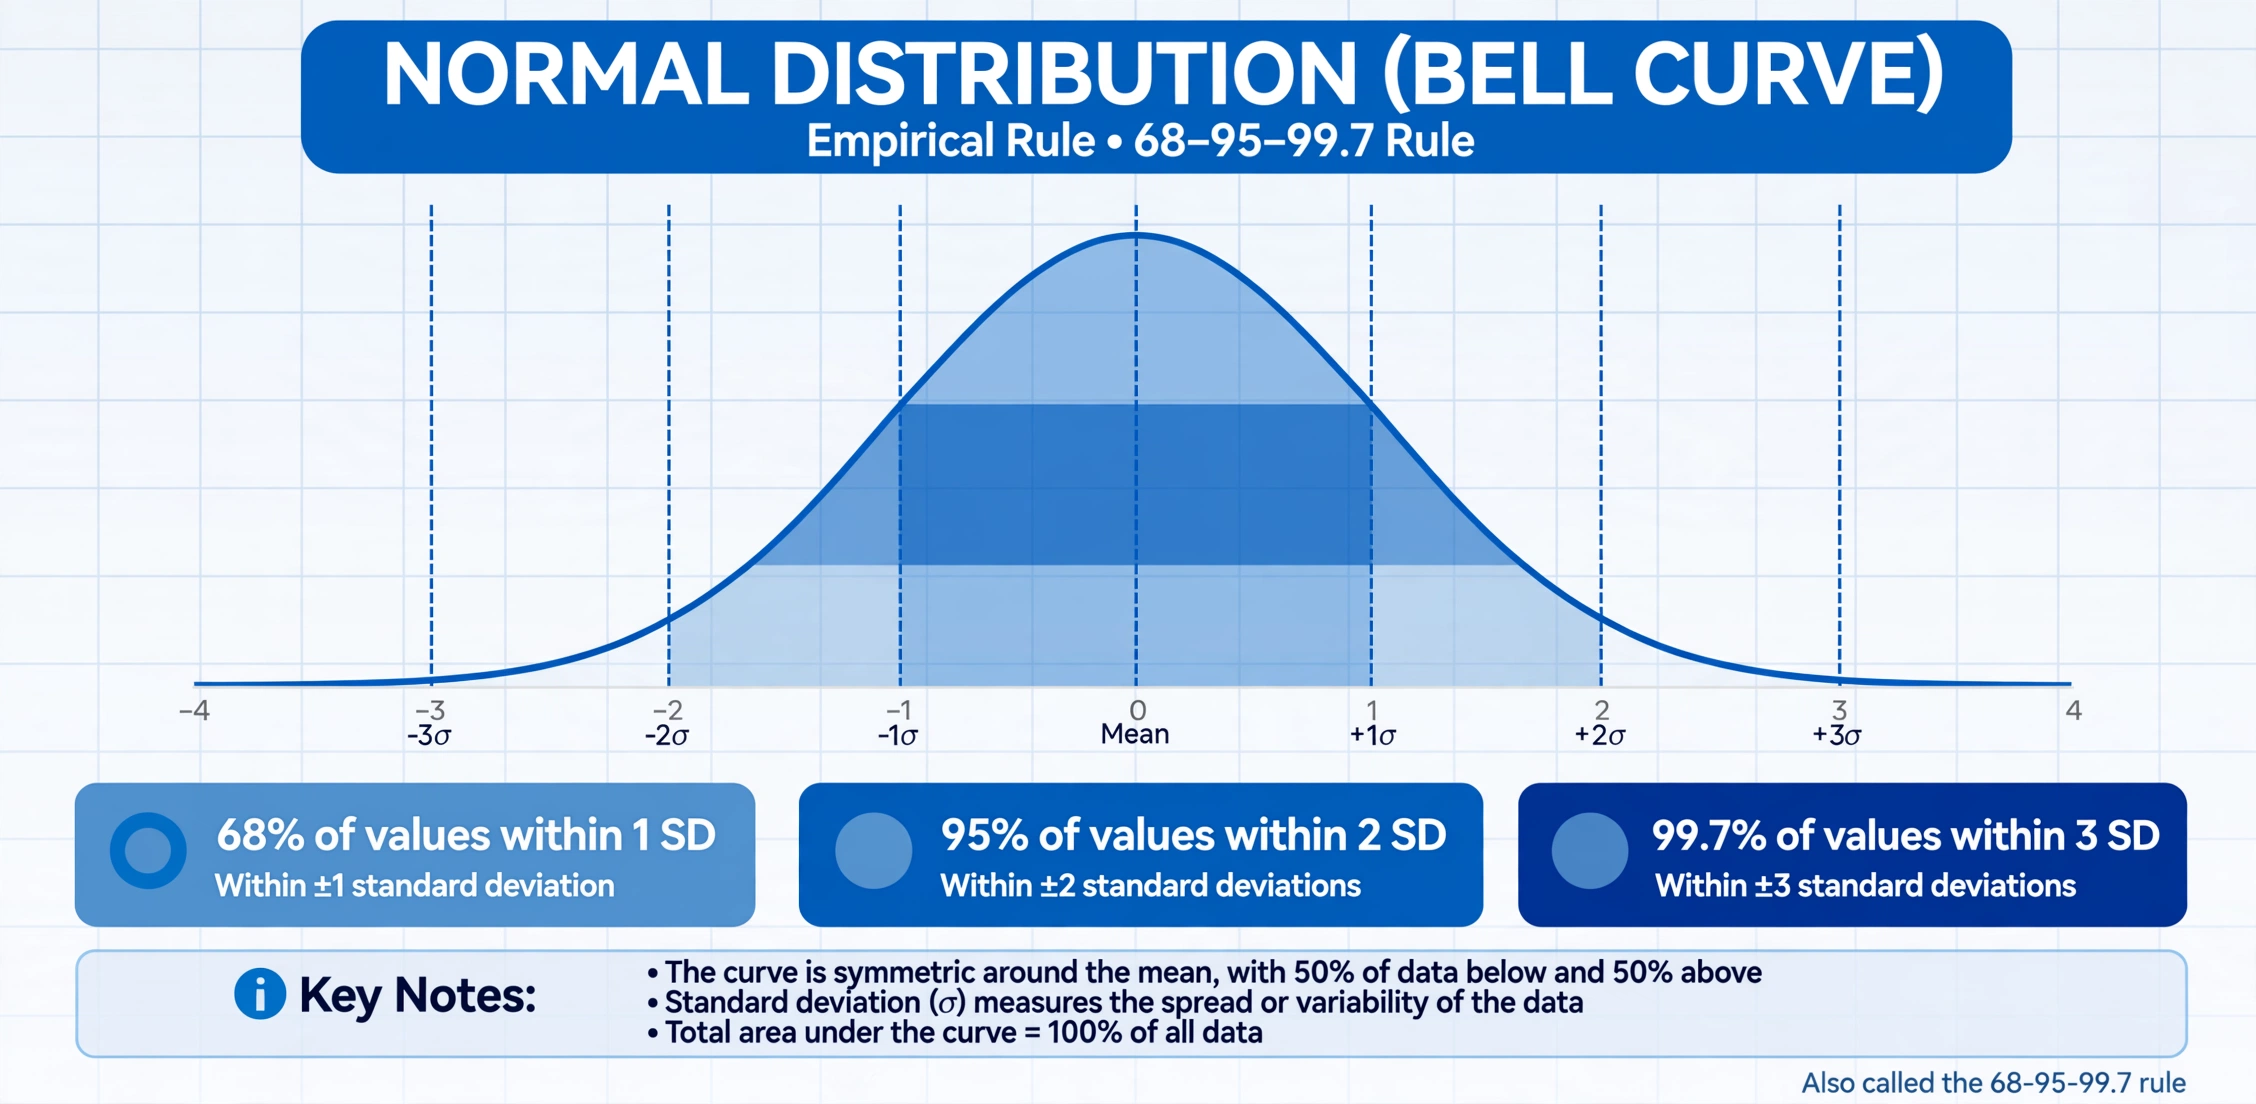
The empirical rule bands
| Band | Share of values | Meaning for mean 70, SD 5 |
|---|---|---|
| Within ±1 SD | ≈ 68% | Scores between 65 and 75 |
| Within ±2 SD | ≈ 95% | Scores between 60 and 80 |
| Within ±3 SD | ≈ 99.7% | Scores between 55 and 85 |
SD is the language of risk and quality
Finance uses SD to measure volatility: a fund with a higher SD swings harder around its average return. Manufacturing uses it for consistency: parts whose dimensions have a tiny SD are interchangeable, while a large SD means frequent rejects. When you need to check a square root by hand along the way, a scientific calculator with a √ key is the practical way to verify each step.
Common standard deviation mistakes
- Using the wrong denominator. Population problems need N, sample problems need N − 1. Check which one your data is before you start.
- Forgetting to square. Averaging the raw deviations always gives zero (the mean balances them by definition) — squaring first is what makes the measure work.
- Claiming a negative SD. SD is a square root of a sum of squares, so it is always zero or positive. A negative result means an arithmetic error.
- Comparing SDs across different units. An SD of 2 points and an SD of 2 dollars are not comparable — and an SD of 20 on salaries averaging 100,000 is tiny, while the same SD on scores out of 100 is huge.
- Trusting the 68-95-99.7 rule on skewed data. The rule assumes a bell shape. For lopsided data like incomes, quote the SD without the rule or describe the skew alongside it.
Frequently asked questions
What is standard deviation?
Standard deviation is a number that measures how spread out the values in a dataset are. It is the square root of the variance and, unlike variance, it is expressed in the same units as the original data — so an SD of 2 on test scores out of 100 means scores typically fall within about 2 points of the average.
What is the difference between population and sample standard deviation?
Population standard deviation (σ) divides the sum of squared deviations by N and is used when your data is the entire group. Sample standard deviation (s) divides by N−1, which corrects the bias from estimating the mean from the same data, and is used when your data is a subset of a larger group. For the same data, the sample value is always slightly larger.
How do I calculate standard deviation step by step?
First find the mean. Then subtract the mean from each value and square the result. Add up all the squared differences. Divide that sum by N for a population (or N−1 for a sample). Take the square root. For 2, 4, 4, 4, 5, 5, 7, 9 the mean is 5, the squared differences add to 32, and the population SD is √(32/8) = 2.
What does a high or low standard deviation mean?
A low standard deviation means the values cluster tightly around the mean; a high one means they are spread far and wide. Class scores of 78, 79, 80, 81, 82 have a small SD, while 60, 70, 80, 90, 100 have a much larger one. Zero SD means every value is identical.
Can standard deviation be negative?
No. Standard deviation is a square root of a sum of squared numbers, and squares are never negative — so SD is always zero or positive. If your calculation gives a negative value, there is an arithmetic error.
What is the difference between standard deviation and variance?
Variance is the average of the squared deviations from the mean; standard deviation is its square root. Variance is in squared units (square dollars, square points), which makes it hard to interpret. SD is in the original units, which is why it is the statistic people usually report.
When should I use population vs sample standard deviation?
Use population SD when your dataset covers the complete group you care about — for example, all employees of a small company. Use sample SD when you measured a subset and want to infer about the larger group — for example, 100 voters surveyed to predict a whole city. Most real-world data is a sample, so s is the safer default.
What is the 68-95-99.7 rule?
For data that follows a roughly bell-shaped (normal) distribution, about 68% of values fall within 1 SD of the mean, about 95% within 2 SD, and about 99.7% within 3 SD. It is a quick way to turn an SD into plain-language statements like 'almost all values are within 2 SD of average.'
Related calculators

Average Calculator
Paste your numbers to get the mean, median, mode, range, min and max.
Use calculatorPercentage Calculator
Solve every percentage problem: percent of a number, change and increase or decrease.
Use calculatorScientific Calculator
Evaluate trig, logarithm, power and root expressions with a full scientific keypad.
Use calculator