Mean Median Mode Calculator: Three Averages, One Tool
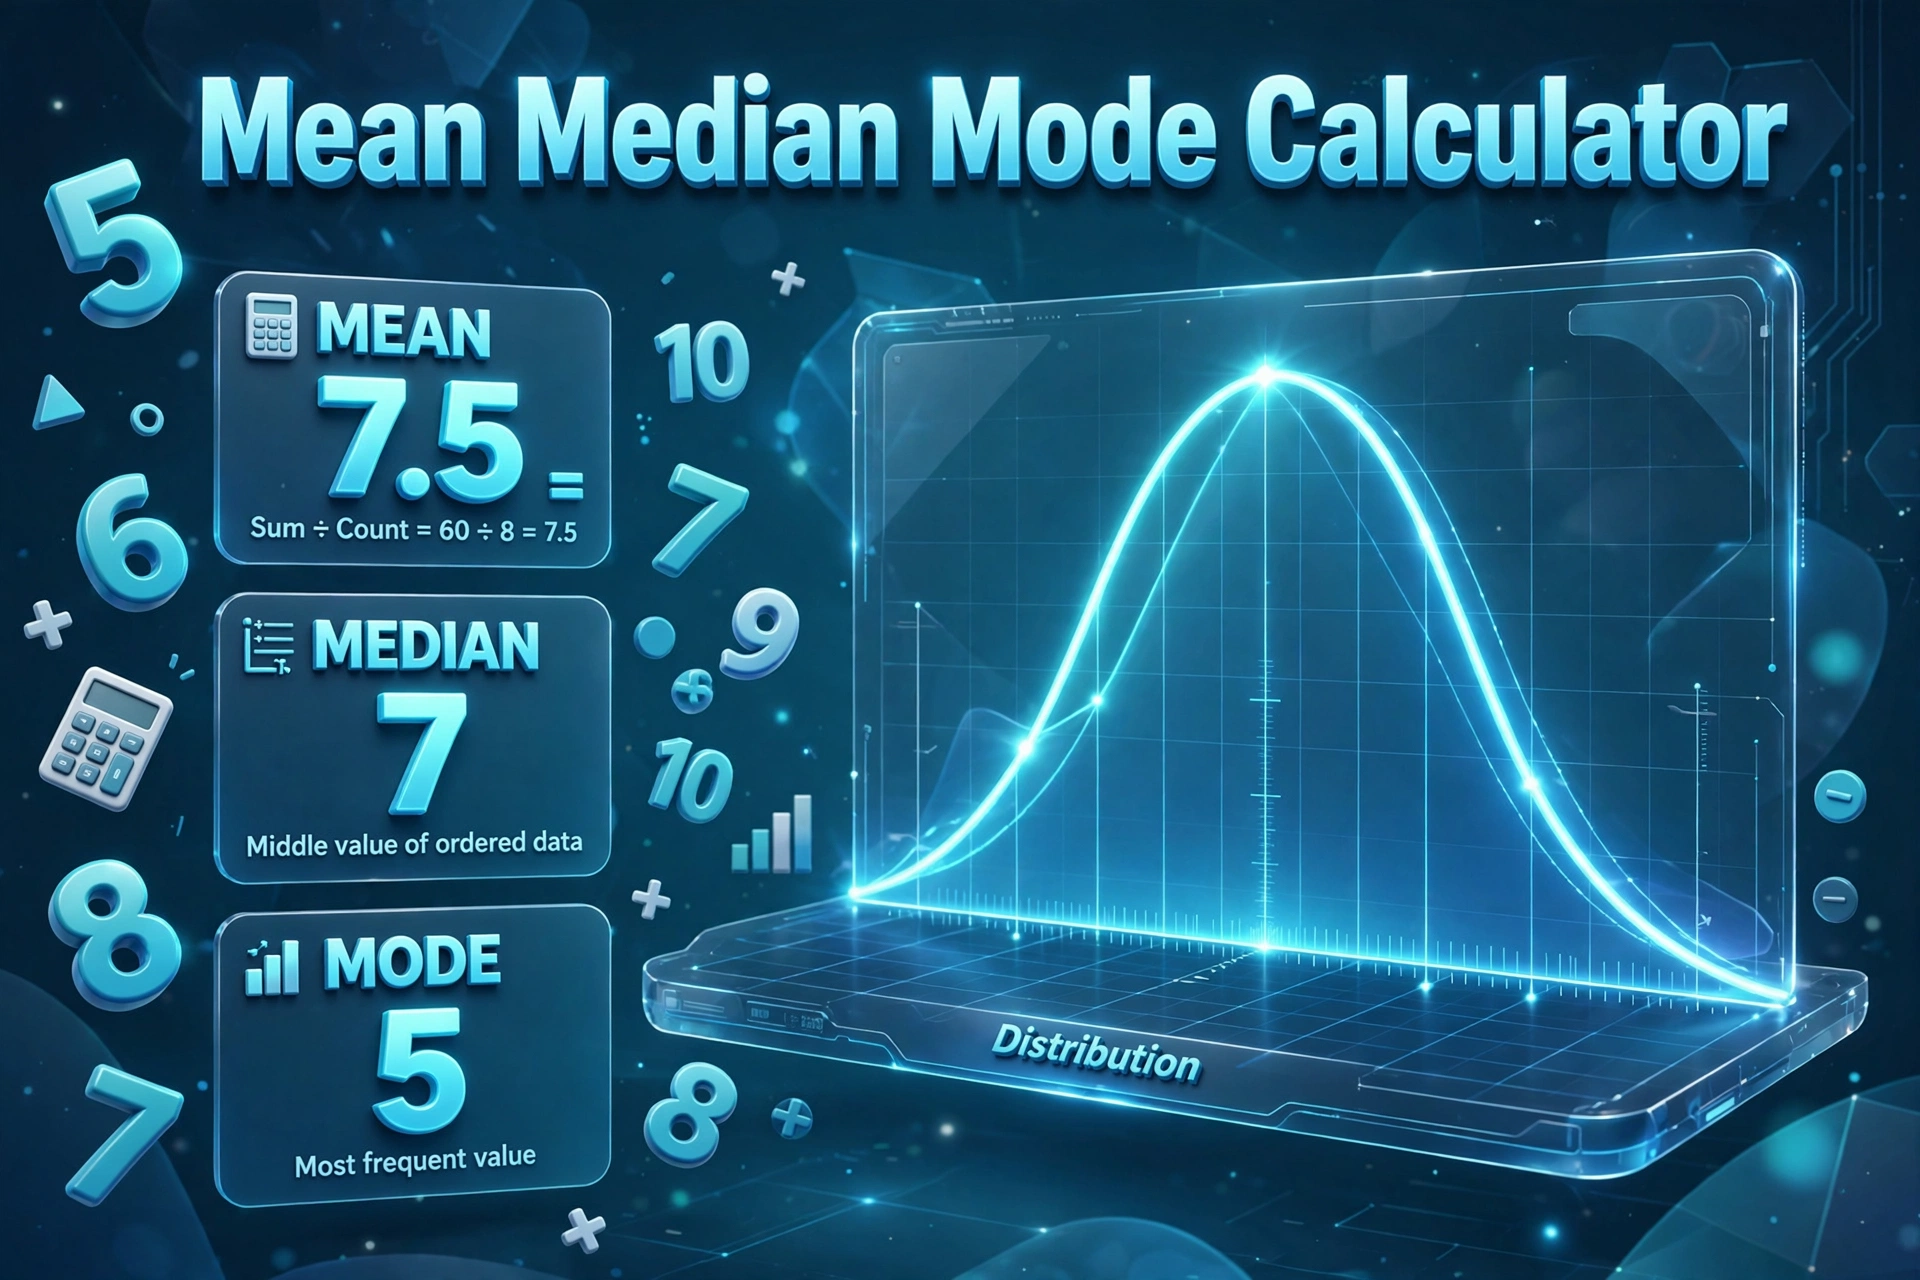
Three different "averages" can tell three different stories about the same data. Paste any list of numbers below, and this free mean median mode calculator will compute all three — plus the range, count and sorted data set — in one click.
Formulas verified against standard references. Calculator logic tested with verified worked examples. Last reviewed: October 2026. Our methodology
Mean, median and mode: the three definitions
Each average answers a different question about the middle of your data:
- Mean = sum ÷ count. The familiar arithmetic average; every value pulls it.
- Median = the middle value of the sorted list (or the average of the two middle values for an even count). It ignores extremes.
- Mode = the value that appears most often. A data set can have two modes, many, or none.
- Range = maximum − minimum, the spread of the data.
| Data set | Mean | Median | Mode |
|---|---|---|---|
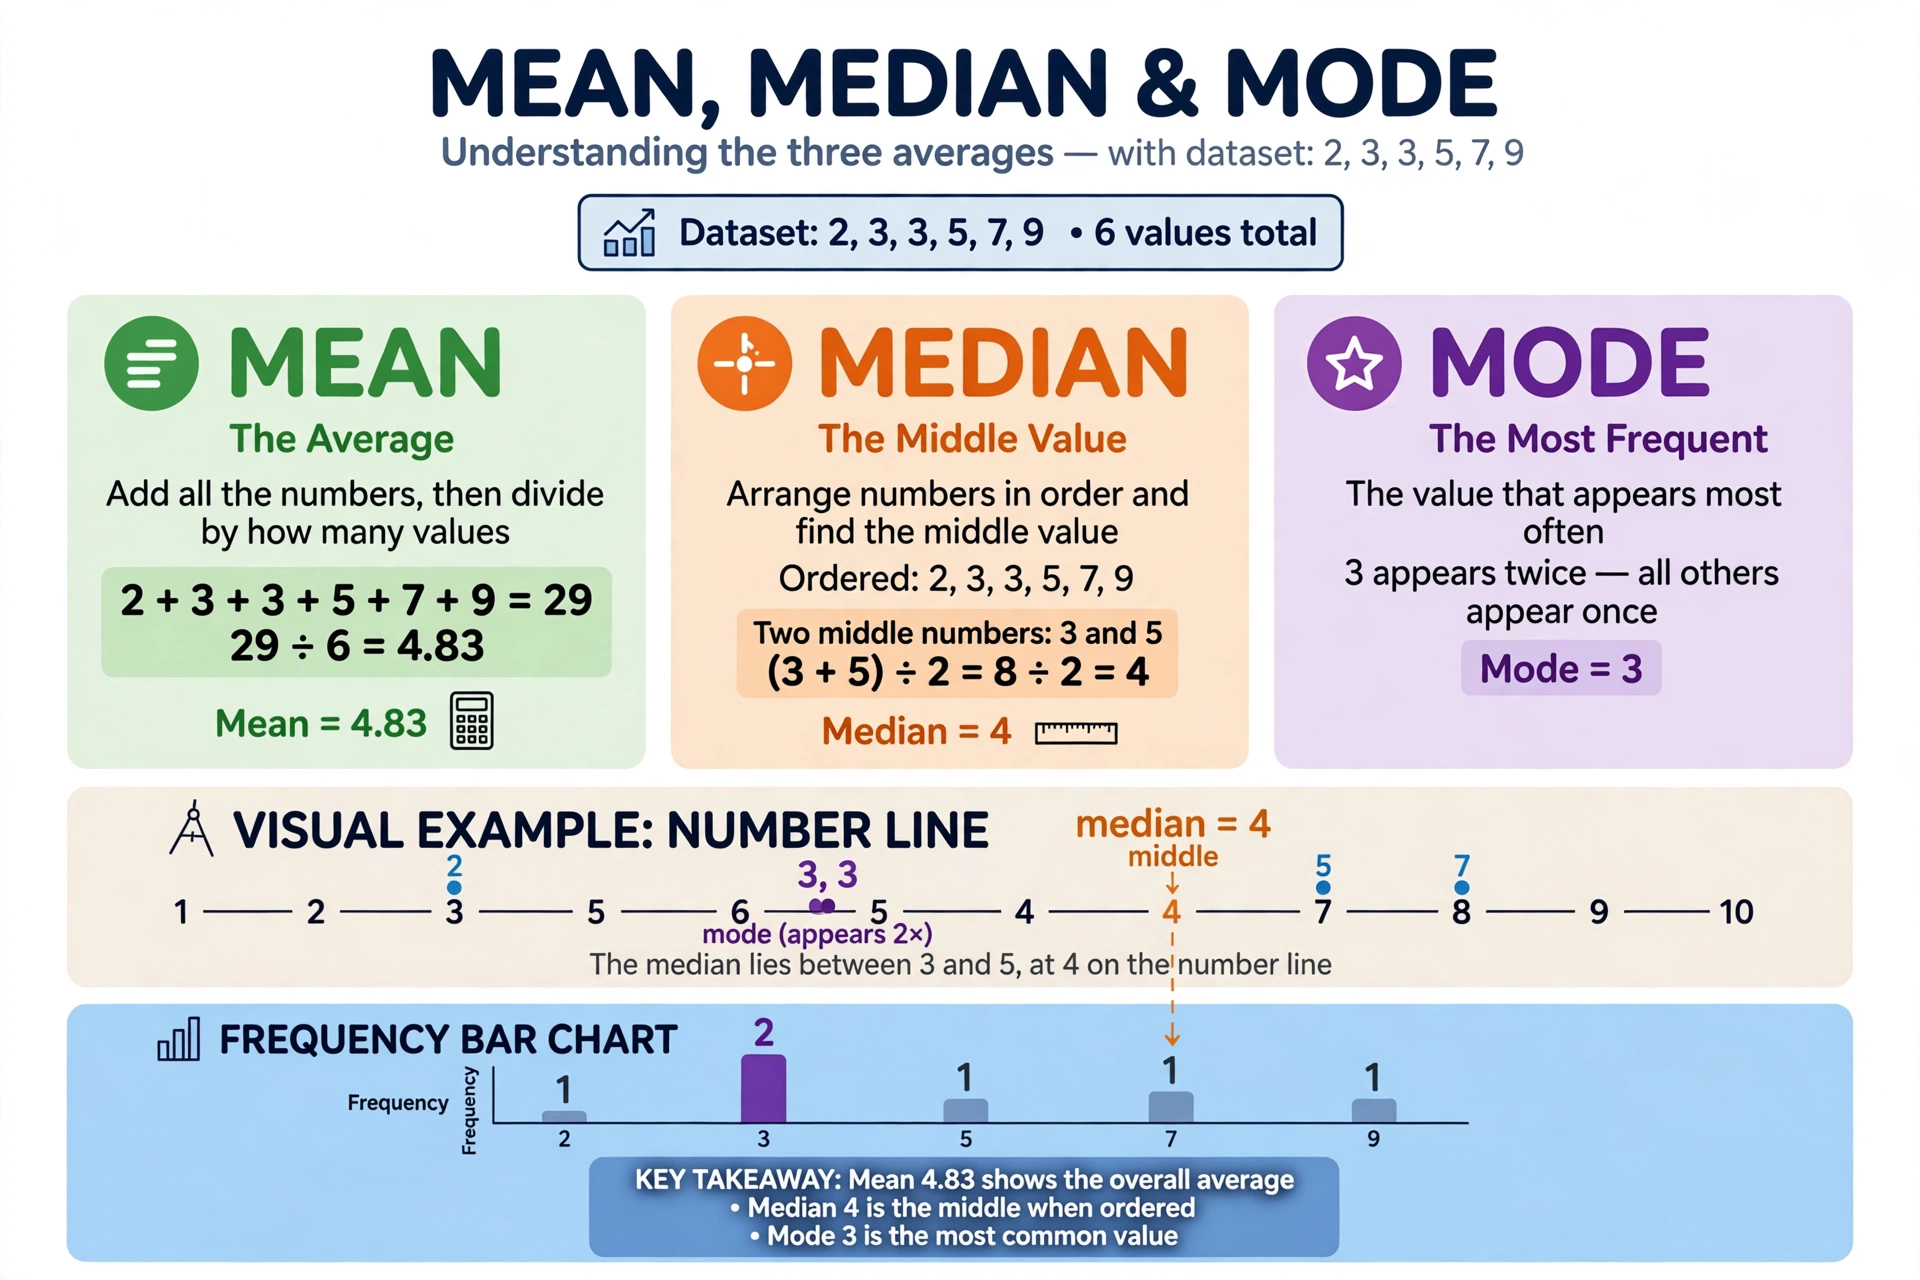
| 2, 3, 3, 5, 7, 9 | 4.83 | 4 | 3 |
| 1, 2, 3, 4, 100 | 22 | 3 | none |
| 5, 5, 8, 8, 9 | 7 | 8 | 5 and 8 |
The second row is the classic lesson: one outlier (100) drags the mean to 22 while the median stays at 3. When data is skewed, the median is usually the honest "typical" value.
Worked example
Find the mean, median and mode of 2, 3, 3, 5, 7, 9.
Mean: (2 + 3 + 3 + 5 + 7 + 9) ÷ 6 = 29 ÷ 6 = 4.83. Median: the list is sorted with an even count, so average the two middle values: (3 + 5) ÷ 2 = 4. Mode: 3 appears twice, everything else once — mode is 3. Range: 9 − 2 = 7.
How to use the mean median mode calculator
Type or paste your numbers — decimals and negatives are fine — and the calculator sorts them and computes everything at once.
Step by step
- Enter your numbers. Separate them with commas, spaces or line breaks: "2, 3, 3, 5, 7, 9".
- Press Calculate. The mean, median and mode appear up top; the full breakdown sits below.
- Read the sorted list. Check it caught every value — a typo'd entry skews all three averages.
- Compare mean vs. median. A big gap means outliers are pulling the mean; trust the median for "typical".
When to use each average
The right average depends on what can go wrong with your data:
| Use the… | When… | Example |
|---|---|---|
| Mean | Data is symmetric, no wild outliers | Average test score in a class |
| Median | Outliers or skew would distort the mean | "Typical" house price in a city |
| Mode | You need the most common case | Most popular shoe size to stock |
This is why economists quote median income, not mean income: a handful of billionaires would make the "average" American look far richer than reality. Whenever someone reports an average without saying which one, ask — the choice can flip the story. For spread as well as center, a standard deviation calculator measures how far values typically stray from the mean.
What "no mode" and "two modes" really mean
Students expect one clean answer, but real data is messier:
- No mode: every value appears exactly once (e.g. 1, 2, 3, 4, 100). The calculator reports this honestly instead of inventing one.
- Bimodal: two values tie for most frequent (e.g. 5, 5, 8, 8, 9). This often signals two hidden groups — like scores from two different classes mixed together.
- Mode of grouped data (test scores in ranges like 70–79) is estimated differently; this calculator works on raw values.
A bimodal result is a clue, not a failure: split the data by the suspected grouping variable and the two humps usually separate into two clean distributions.
Mean vs. median in the real world
The mean–median gap is one of the most abused statistics in public debate:
- Housing: a few $10M sales lift the mean price far above what a typical buyer pays — the median is the honest benchmark.
- Salaries: "average salary" at a company with one highly-paid executive misleads; the median salary describes the typical employee.
- Response times: one 30-second outage wrecks the mean; the median (or 95th percentile) describes normal experience.
Rule of thumb: if the data can contain extremes — money, waiting times, sizes — lead with the median and mention the mean as context, not the headline.

Frequently asked questions
How do you find the mean, median and mode?
Mean: add all values and divide by the count. Median: sort the list and take the middle value (or average the two middle ones). Mode: the value that appears most often. For 2, 3, 3, 5, 7, 9: mean 4.83, median 4, mode 3.
What is the difference between mean and median?
The mean is the arithmetic average (sum ÷ count); the median is the middle value when sorted. Outliers pull the mean but barely move the median, so the median better represents 'typical' in skewed data like incomes or house prices.
Can a data set have more than one mode?
Yes — it is called bimodal (two modes) or multimodal. It usually means two subgroups are mixed in the data. If every value appears exactly once, there is no mode at all.
When should I use median instead of mean?
When outliers or skew exist: incomes, house prices, response times. The median describes the typical case; the mean describes the total divided evenly, which outliers distort.
What does the range tell you?
Range = maximum − minimum. It is the simplest measure of spread — how far apart the extremes are. It says nothing about how values cluster in between.
How many numbers do I need?
At least two for the calculator to run. Mean and median get more stable as the count grows; the mode needs enough values for repeats to emerge.
Why do mean and median differ so much sometimes?
Skew. In 1, 2, 3, 4, 100 the mean is 22 but the median is 3 — the single large value drags the average up while the middle of the data never moved.