Variance Calculator
Find how spread out a list of numbers is. Paste your numbers, pick population or sample, and get the variance, the standard deviation, the mean and a per-value breakdown. Free, no sign-up, everything runs in your browser.
Formulas: Population variance = sum of (x − mean)² ÷ n. Sample variance = sum of (x − mean)² ÷ (n − 1).

Formulas verified against standard references. Calculator logic tested with verified worked examples. Published: November 8, 2026 | Last updated: November 8, 2026. Fact-checked: November 8, 2026. Our methodology
How to Use the Variance Calculator
Getting an answer takes three quick steps. The tool finds how spread out a list of numbers is, with every deviation shown so you can check the math.
- Pick Sample if your numbers are a subset of a larger group, or Population if they are the whole group you care about.
- Paste or type your numbers in the box, separated by commas, spaces or line breaks.
- Press Calculate, or press Enter. The variance appears first and large, with the standard deviation, the mean, the step-by-step math and a per-value breakdown below. Press Reset to restore the example list and start over.
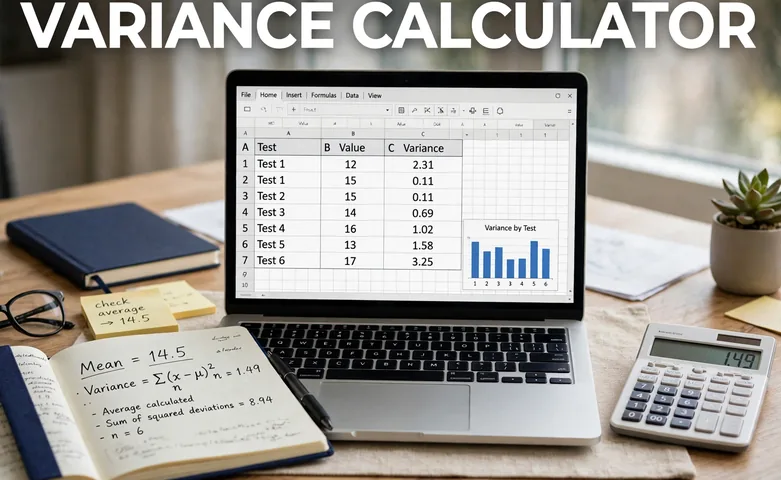
The Variance Formulas
Variance is the average of the squared differences from the mean. Two formulas cover the two cases, and they differ only in the divisor.
Population variance: σ² = Σ(x − μ)² ÷ N, where x is each value, μ is the population mean and N is the number of values.
Sample variance: s² = Σ(x − x̄)² ÷ (n − 1), where x̄ is the sample mean and n is the number of values. The n − 1 is called Bessel's correction. A sample tends to underestimate the spread of the full group, so dividing by a slightly smaller number corrects that bias. The formulas come from the standard statistics definition used by university courses and by the standard deviation calculator.
Worked Example: 2, 4, 4, 4, 5, 5, 7, 9
Take the eight numbers 2, 4, 4, 4, 5, 5, 7, 9. Here is exactly what the calculator does.
- Find the mean: the numbers add to 40, and 40 ÷ 8 = 5.
- Subtract the mean from each number: −3, −1, −1, −1, 0, 0, 2, 4.
- Square each difference: 9, 1, 1, 1, 0, 0, 4, 16. Add the squares: 9 + 1 + 1 + 1 + 0 + 0 + 4 + 16 = 32.
- Population variance = 32 ÷ 8 = 4. Sample variance = 32 ÷ 7 = 4.57.
- The standard deviation is the square root: 2.00 for the population and 2.14 for the sample.
As a second check, the numbers 10, 20, 30 have a mean of 20, squared deviations of 100, 0 and 100, a sum of 200, a population variance of 200 ÷ 3 = 66.67 and a sample variance of 200 ÷ 2 = 100.
Population or Sample: Which to Pick
Pick Population when your list is the entire group you care about. Test scores for all 30 students in one class are a population if you only care about that class. Pick Sample when your list is a subset drawn from a larger group, such as 50 employees surveyed out of 500 at a company.
For the same data, the sample variance is always a little larger, by a factor of n divided by n minus 1. With 8 numbers the factor is 8 divided by 7, about 1.14, which is why the worked example gives 4.57 for the sample and 4 for the population. With hundreds of numbers the difference nearly vanishes, but with a small list it matters, so pick the mode before you read the answer.
Variance vs Standard Deviation
Variance and standard deviation describe the same spread in different units. Variance is measured in squared units, so test scores give a variance in points squared, which is hard to picture. Standard deviation is the square root of variance, so it comes back in the original units and is easier to read.
Use variance when the math needs it, such as combining groups or testing, and use standard deviation when you explain the spread to someone. This tool shows both, so you never have to choose. If you only need the average itself, the mean, median and mode calculator and the average calculator give it with the same list.
Common Variance Mistakes
Dividing a sample by n instead of n minus 1 is the most common error. It makes the variance too small and it understates how spread out the group really is. If your data is a sample, always use n minus 1.
Forgetting to square the differences is next. Adding plain differences always gives zero, because the values above the mean cancel the values below it. Squaring stops the cancellation and is what makes variance work.
Asking for the variance of a single number is a third trap. A single value has a population variance of 0, since it cannot differ from its own mean, but a sample variance needs at least two numbers, because dividing by n minus 1 would mean dividing by zero. This tool blocks that case with a plain message instead of a broken answer.

Frequently asked questions
What is variance?
Variance measures how spread out a set of numbers is around its mean. It is the average of the squared differences from the mean. A variance of 0 means every number is identical, and a larger variance means the numbers are more spread out.
How is variance different from standard deviation?
Standard deviation is the square root of variance. Variance is measured in squared units, while standard deviation is measured in the original units, so it is easier to picture. For the numbers 2, 4, 4, 4, 5, 5, 7, 9 the population variance is 4 and the standard deviation is 2.
Why divide by n minus 1 for a sample?
A sample tends to underestimate the spread of the full population, because the sample mean sits closer to the sample values than the true mean does. Dividing by n minus 1 instead of n corrects that bias. This adjustment is called Bessel's correction.
What does a variance of 0 mean?
It means every number in the list is identical. Each value equals the mean, so every difference is 0, every squared difference is 0, and the average is 0.
Can variance be negative?
No. Variance is an average of squared numbers, and squares are never negative. If a calculation gives a negative variance, the arithmetic went wrong somewhere.
How many numbers do I need?
One number is enough for a population variance, which is 0. A sample variance needs at least 2 numbers, because it divides by n minus 1. This tool accepts up to 10,000 numbers.
Related calculators

Standard Deviation Calculator
Find how spread out a set of numbers is.
Use calculatorMean Median Mode Calculator
Find the mean, median and mode of any list.
Use calculatorAverage Calculator
Work out the average of a list of numbers.
Use calculatorSquare Root Calculator
Find the square root of any number.
Use calculatorProbability Calculator
Work out the chance of an event happening.
Use calculatorPercentage Calculator
Find what P% of any number is, instantly.
Use calculator