Coefficient of Variation Calculator
Compare the spread of data sets that use different units or scales. Enter your numbers to see the mean, the standard deviation and the coefficient of variation as a percentage.
Formula: CV = (standard deviation / absolute value of the mean) x 100. Sample standard deviation divides by n - 1. Population standard deviation divides by n.

Formulas verified against standard references. Calculator logic tested with verified worked examples. Published: November 11, 2026 | Last updated: November 11, 2026. Fact-checked: November 11, 2026. Our methodology
How to Use the Coefficient of Variation Calculator
Enter your numbers, pick sample or population, and the calculator returns the mean, the standard deviation and the CV as a percentage. The CV lets you compare the spread of data sets that use different units or very different scales.
- Enter your data values, separated by commas or spaces. You need at least 2 numbers.
- Pick Sample when your numbers come from a larger group, or Population when they are the whole group.
- Pick how many decimal places to show in the CV.
- Press Calculate, or press Enter. The CV appears first and large, with the mean, the standard deviation and the variance below, then the step by step working.
The Coefficient of Variation Formula
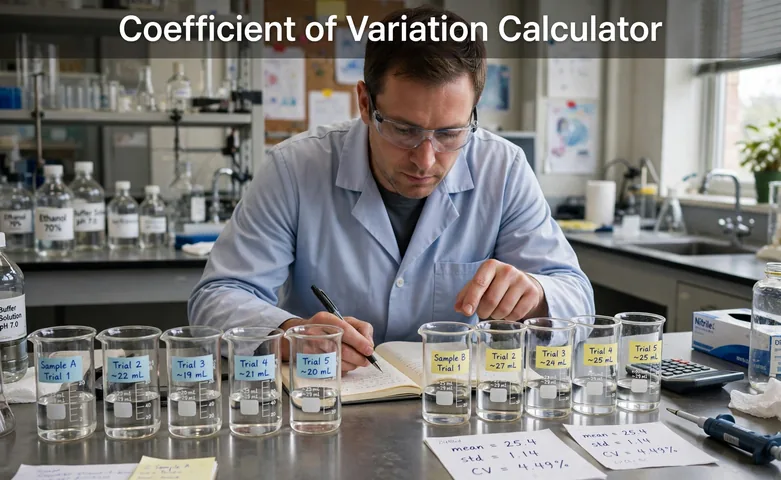
The coefficient of variation, written CV, is the standard deviation expressed as a percentage of the mean. The formula is CV = (standard deviation / absolute value of the mean) x 100. The absolute value keeps the result positive when the mean is negative.
The one choice inside the formula is sample or population. The sample standard deviation divides the sum of squared differences by n - 1. The population standard deviation divides by n. The same data gives a slightly larger CV as a sample, because n - 1 is smaller than n. Our standard deviation calculator shows both versions of the standard deviation on their own.
Worked Example: 10, 12, 14, 16, 18
Five measurements are 10, 12, 14, 16, 18. Treat them as a sample and find the CV.
- Find the mean. (10 + 12 + 14 + 16 + 18) / 5 = 70 / 5 = 14.
- Find the squared differences from the mean. They are 16, 4, 0, 4, 16, and they add to 40.
- Find the sample variance. 40 / (5 - 1) = 40 / 4 = 10.
- Find the sample standard deviation. The square root of 10 is 3.16.
- Find the CV. (3.16 / 14) x 100 = 22.59%.
As a population the same data gives a variance of 40 / 5 = 8, a standard deviation of 2.83 and a CV of 20.20%. The same steps work for any data set, so try your own numbers in the tool above.
Sample or Population: Which One to Pick
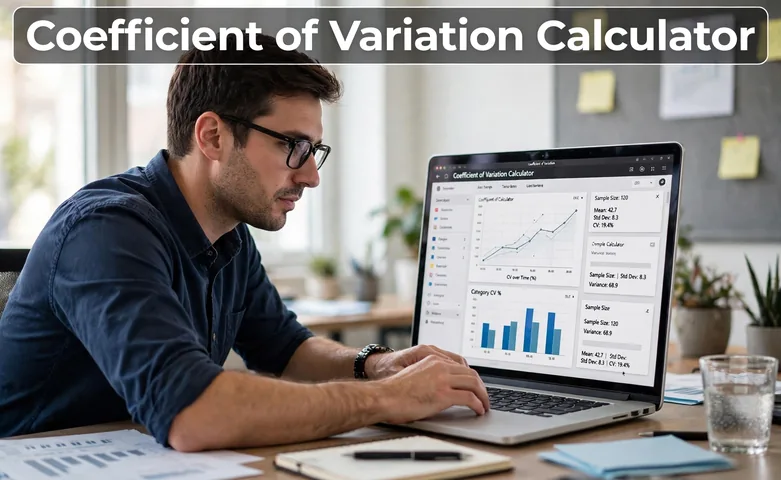
Pick Sample when your numbers are a slice of something bigger. A week of production sampled from a year, a class sampled from a school, or a survey of 200 voters all count as samples. The n - 1 divisor corrects for the fact that a sample tends to understate the spread of the full group.
Pick Population when your numbers are the whole group you care about. Every part the factory made today, every student in a class, or every month of a full year all count as populations. Then divide by n, because nothing is left out.
The choice matters most for small data sets. With 5 values the sample CV is 22.59 percent and the population CV is 20.20 percent. With 100 values the two answers sit almost on top of each other. When in doubt, pick Sample, because most real data is a sample of something larger.
How to Read a CV Value
A CV near zero means the values hug the mean. A CV of 3.81 percent, like the set 100, 102, 98, 105, 95, means the typical value sits about 4 percent from the mean. As a rough guide, a CV up to 5 percent counts as low, up to 15 percent as moderate, up to 30 percent as high, and above 30 percent as very high. These bands are a guide only. What counts as high depends on the field, so check the standard for your own work.
The real power of CV is comparison. Two data sets can have the same standard deviation and very different CVs. A standard deviation of 3.16 is small next to a mean of 100, where the CV is 3.16 percent, and large next to a mean of 14, where the CV is 22.59 percent. CV strips out the units, so dollars, grams and seconds can be compared on the same scale. Our variance calculator shows the raw spread that CV turns into a percentage.
When the Coefficient of Variation Misleads
CV breaks down when the mean is close to zero. Dividing by a tiny mean blows the percentage up, so a small shift in the data swings the CV wildly. When the mean is exactly zero, CV is undefined, and the calculator says so instead of giving a number.
CV also needs a scale with a real zero. It works for length, weight, money and time, where zero means none. It does not work for temperature in Celsius or Fahrenheit, where zero is an arbitrary mark, or for test scores on a scale that starts at an arbitrary point. A mean of -20 with a standard deviation of 10 gives a CV of 50 percent, which is arithmetically correct but hard to interpret when the numbers can cross zero.
Finally, CV hides shape. Two data sets can share a CV of 20 percent while one is symmetric and the other is skewed with an outlier. Pair CV with a plot or a look at the quartiles before you draw a conclusion. Our mean, median and mode calculator shows the center three ways, which helps spot skew.

Frequently asked questions
What is the coefficient of variation?
The coefficient of variation, written CV, is the standard deviation expressed as a percentage of the mean. It measures relative spread, so data sets with different units or scales can be compared. A CV of 22.59 percent means the standard deviation is about 23 percent of the mean.
How do you calculate the coefficient of variation?
Find the mean, find the standard deviation, divide the standard deviation by the absolute value of the mean, then multiply by 100. For 10, 12, 14, 16, 18, the mean is 14, the sample standard deviation is 3.16, and the CV is 22.59 percent.
What is a good coefficient of variation?
There is no universal good value. As a rough guide, up to 5 percent counts as low, up to 15 percent as moderate, up to 30 percent as high, and above 30 percent as very high. What counts as high depends on the field, so check the standard for your own work.
What is the difference between sample and population CV?
The sample CV divides by n - 1 in the standard deviation, and the population CV divides by n. The data 10, 12, 14, 16, 18 gives a sample CV of 22.59 percent and a population CV of 20.20 percent. Pick sample when the data comes from a larger group.
Can the coefficient of variation be negative?
No. CV uses the absolute value of the mean, so the result is never negative. But CV is undefined when the mean is zero, because the formula divides by the mean.
Why use CV instead of standard deviation?
Standard deviation measures spread in the original units, so it cannot compare a data set in dollars with one in grams. CV divides the spread by the mean, which cancels the units and gives a percentage that works across any scale.
Related calculators

Standard Deviation Calculator
Find the standard deviation of a data set.
Use calculatorVariance Calculator
Find the variance of a data set.
Use calculatorMean Median Mode Calculator
Find the mean, median and mode of a data set.
Use calculatorZ-Score Calculator
Find how many standard deviations a value is from the mean.
Use calculatorAverage Calculator
Find the average of a list of numbers.
Use calculatorPercentage Calculator
Find what a percentage of any number is.
Use calculator