Break-Even Calculator
Find exactly how many units you need to sell to cover all your costs. Enter your fixed costs, variable cost per unit, and selling price to get break-even units and revenue, the contribution margin per unit and ratio, plus optional extras: how many units hit a target profit, and your margin of safety at expected sales.

Formulas verified against standard references. Calculator logic tested with verified worked examples. Last reviewed: October 2026. Our methodology
The Break-Even Formula
Break-even is the sales volume where total revenue exactly equals total costs: not a dollar of profit, not a dollar of loss. The formula is break-even units = fixed costs ÷ (price per unit − variable cost per unit).
The denominator has its own name: the contribution margin per unit, the amount each sale contributes toward covering fixed costs. Once cumulative contribution margin equals fixed costs, every further sale is profit. A coffee shop with $9,500 monthly fixed costs, $0.75 variable cost per cup, and a $4.50 price has a $3.75 margin and breaks even at 2,534 cups a month.
| Input | Coffee shop example | Role |
|---|---|---|
| Fixed costs | $9,500 / month | Covered by total margin |
| Variable cost / unit | $0.75 | Subtracted from price |
| Price / unit | $4.50 | Creates the margin |
| Contribution margin | $3.75 | Pays down fixed costs |
| Break-even | 2,534 cups | $9,500 / $3.75, rounded up |
Fixed vs Variable Costs
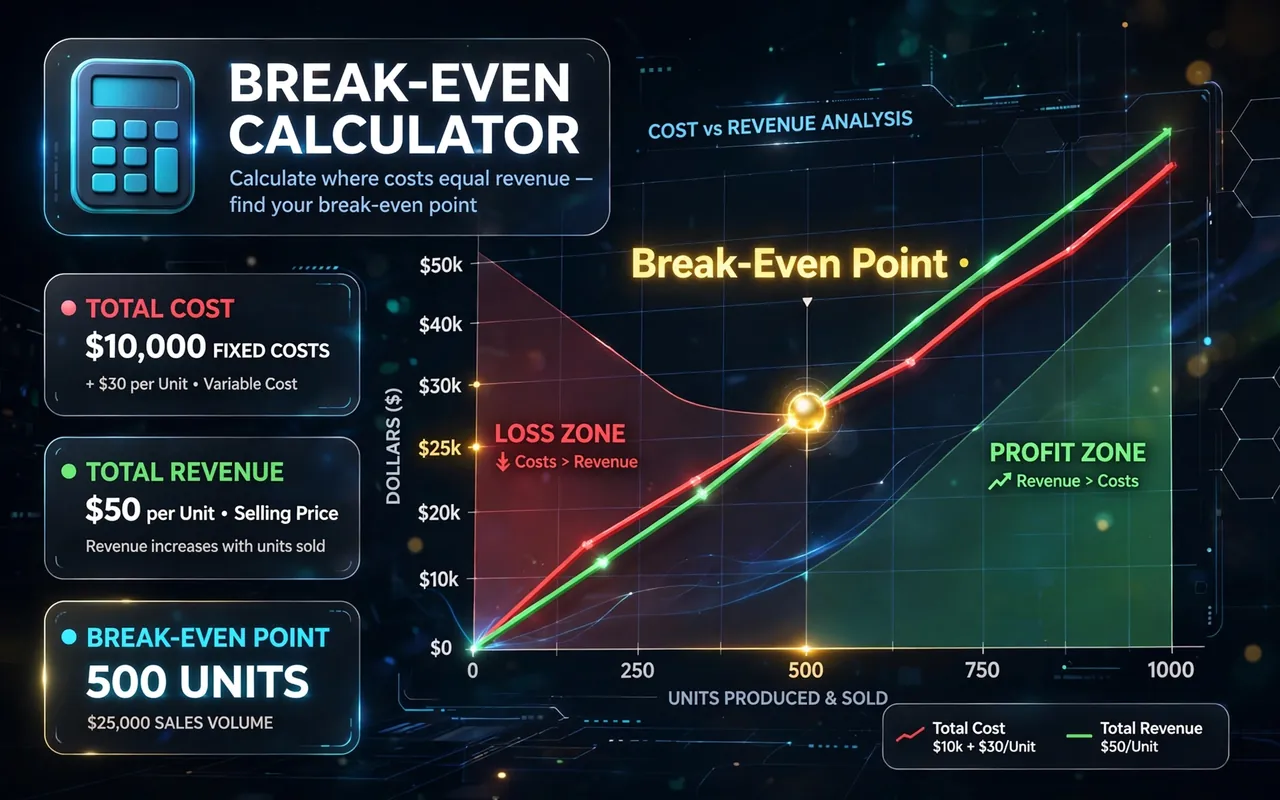
Fixed costs stay the same whether you sell one unit or ten thousand: rent, salaried payroll, insurance, software subscriptions. Variable costs scale with each unit: materials, packaging, per-unit shipping, payment processing fees.
Getting this split right is the whole analysis. Labor is the classic gray area: salaried staff are fixed, hourly production wages tied to output are variable. When in doubt, ask whether the cost changes if you sell one more unit this month; if yes, it is variable.
| Cost type | Changes with volume? | Examples |
|---|---|---|
| Fixed | No | Rent, salaries, insurance, software |
| Variable | Yes, per unit | Materials, shipping, packaging, card fees |
| Mixed | Partly | Utilities, phone plans: split into both parts |
Contribution Margin Ratio
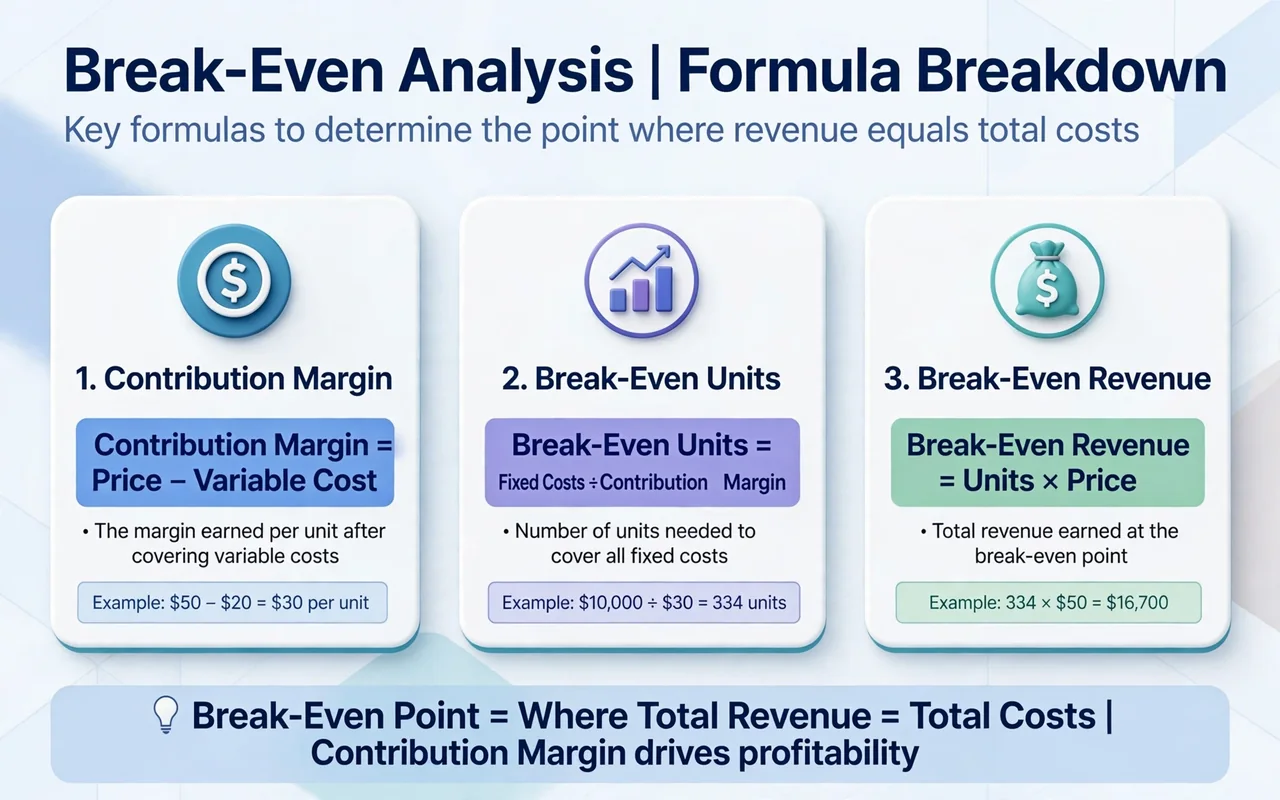
The contribution margin ratio = contribution margin ÷ price × 100. It tells you what share of each revenue dollar is available for fixed costs and profit. The coffee shop's $3.75 margin on a $4.50 price is an 83.3% ratio: every $1 of sales contributes $0.83 toward fixed costs.
The ratio also gives break-even revenue directly: fixed costs ÷ ratio. $9,500 ÷ 0.833 ≈ $11,400 in monthly sales. Use units when you sell countable items, revenue when you sell services or mixed baskets.
Target Profit: Beyond Breaking Even
Breaking even is survival; businesses plan for profit. Enter a target profit and the calculator returns the units needed to reach it: (fixed costs + target profit) ÷ contribution margin. A $2,000 monthly profit target on the coffee shop needs (9,500 + 2,000) ÷ 3.75 = 3,067 cups.
This is also how you price-test: if 3,067 cups is more than the shop can physically serve, the lever is price, variable cost, or fixed costs, not wishful volume. Small price rises cut break-even fast because the whole increase drops into the margin.
| Lever | Coffee shop change | New break-even |
|---|---|---|
| Raise price to $5.00 | Margin $4.25 | 2,236 cups |
| Cut variable cost to $0.50 | Margin $4.00 | 2,375 cups |
| Cut fixed costs to $8,000 | Same margin | 2,134 cups |
Margin of Safety
Enter your expected unit sales and the calculator shows projected profit (expected units × margin − fixed costs) and the margin of safety: (expected − break-even) ÷ expected × 100. It answers how far sales can fall before losses start.
A 20% margin of safety means sales can drop a fifth before the business bleeds. Thin margins of safety are normal for high-fixed-cost businesses like airlines and restaurants, which is exactly why they watch volume so nervously.
What Break-Even Assumes
The model assumes one product, one price, and constant variable cost per unit. Real businesses have discounts, bulk pricing, and volume discounts on inputs, so rerun the numbers when prices or costs change rather than trusting last quarter's break-even.
It also assumes everything produced gets sold; unsold inventory still incurred its variable cost. For multi-product businesses, use a blended average price and variable cost weighted by sales mix. And for commission-driven pay structures feeding into variable cost, the commission calculator pins down the per-unit payout first.
Frequently asked questions
What is the break-even point?
The sales volume where total revenue equals total costs: fixed costs / (price per unit - variable cost per unit). Sell one more unit beyond it and you start profiting.
What is contribution margin?
Price per unit minus variable cost per unit: what each sale contributes toward fixed costs, then profit. The ratio form divides that by the price.
What if my price is below variable cost?
Then there is no break-even point: every sale loses money, and more volume only scales the loss. Raise the price or cut the variable cost first.
Should I use monthly or yearly fixed costs?
Either, but stay consistent: monthly fixed costs give a monthly break-even in units, yearly totals give the yearly number.
Why are break-even units rounded up?
You cannot sell a fraction of a cup or a unit, so 2,533.33 cups becomes 2,534. Rounding down would leave you short of covering costs.
What is margin of safety?
How far sales can fall before losses begin: (expected sales - break-even sales) / expected sales x 100.
How do I lower my break-even point?
Raise price, cut variable cost per unit, or cut fixed costs. Price rises are usually the fastest lever because the full increase lands in the margin.