Stock Profit Calculator
Find your true profit on a stock trade, not just sell minus buy. Enter the buy and sell prices, share count, commissions on both sides, any dividends received, and optionally your holding period, and get gross profit, net profit after all costs, return percentage, the break-even sell price, and the annualized return.

Formulas verified against standard references. Calculator logic tested with verified worked examples. Last reviewed: October 2026. Our methodology
Gross Profit vs Net Profit
Gross profit is the simple part: (sell price − buy price) × shares. Buy 100 shares at $50 and sell at $65, and the gross profit is $1,500. But that is not what lands in your account.
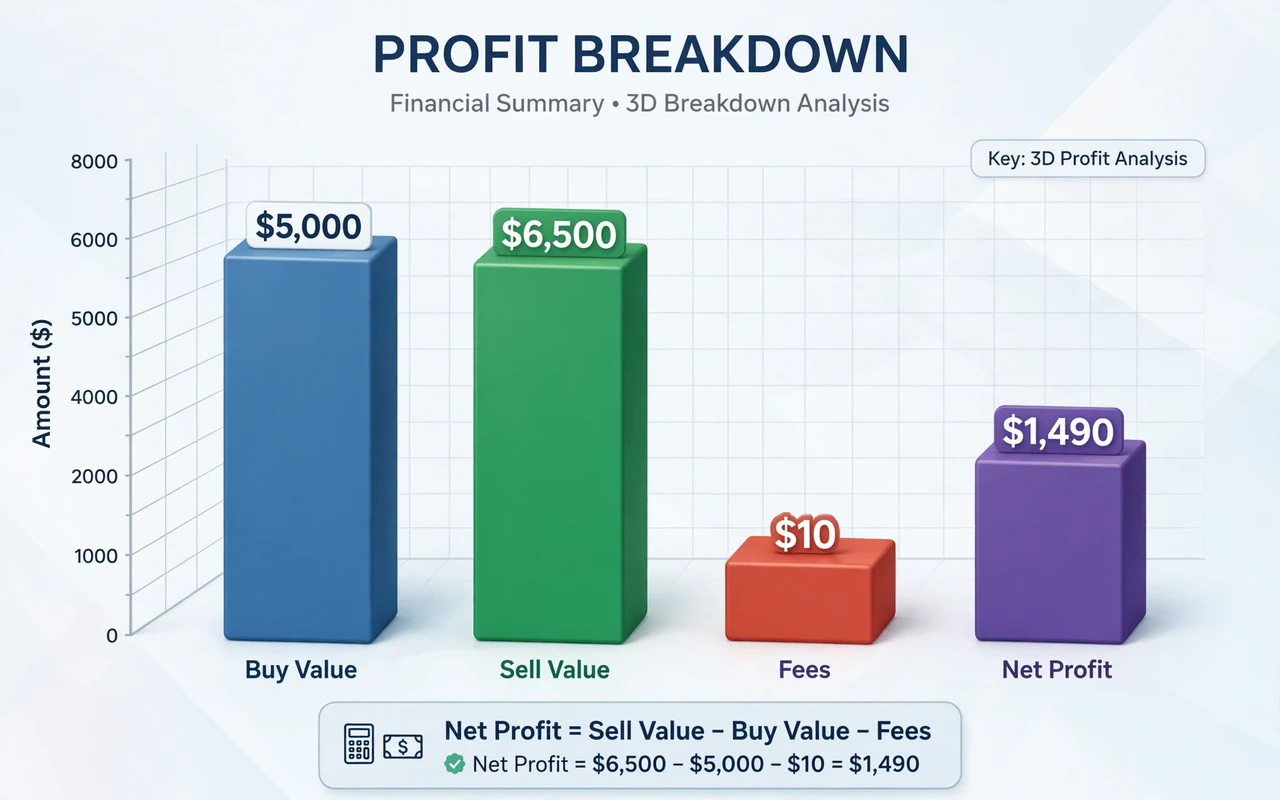
Net profit subtracts everything the trade actually cost: the buy-side commission, the sell-side commission, and any regulatory fees, then adds back dividends received. With $4.95 commission on each side, that $1,500 gross becomes $1,490.10 net. On small trades or frequent trading, fees quietly eat a meaningful slice, which is why the calculator keeps every line visible.
| Line | 100 shares at $50 to $65 | Amount |
|---|---|---|
| Buy value | 100 x $50 | $5,000 |
| Sell value | 100 x $65 | $6,500 |
| Gross profit | $6,500 - $5,000 | $1,500 |
| Commissions | $4.95 + $4.95 | $9.90 |
| Net profit | $1,500 - $9.90 | $1,490.10 |
| Return | $1,490.10 / $5,004.95 | 29.77% |

Return Percentage: The Number That Compares
A $1,500 profit means little until you know the capital behind it. Return percentage = net profit ÷ total cost basis × 100, where the cost basis is buy value plus buy commission. That $1,490.10 on a $5,004.95 basis is a 29.77% return.
This is the figure that lets you compare trades of different sizes, and compare a trade against doing nothing: money sitting in savings. A big dollar profit on a huge position can be a worse return than a small profit on a small one.
Break-Even Sell Price
The break-even sell price is the price per share at which the trade nets exactly zero: (buy value + total fees − dividends) ÷ shares. With $5,000 of stock, $9.90 in commissions, and no dividends, you break even at $50.099 per share, not $50.
Traders use it to set stop-losses and profit targets with open eyes: any exit below break-even locks in a loss after costs, even if the quoted price is above the buy price. Dividends received push the break-even below your buy price, which is why dividend stocks can show a profit on a flat-looking trade.
Annualized Return and Holding Period
A 30% gain in three months and a 30% gain in three years are very different outcomes. Annualized return converts any holding period into a comparable yearly rate: (end value ÷ start value)^(365/days) − 1, where end value includes dividends and subtracts sell fees.
Enter your holding days to see it. The formula assumes one lump sum with nothing added or withdrawn, so it fits single buy-and-sell trades, not portfolios with ongoing deposits. For money growing untouched over years, the compound interest calculator models that compounding directly.
| Holding period | Same $1,490.10 net on $5,004.95 | Annualized |
|---|---|---|
| 90 days | 29.77% total | ~188% |
| 1 year | 29.77% total | 29.77% |
| 3 years | 29.77% total | ~9.1% |
Dividends Change the Math
Cash dividends received while holding the shares are part of your total return, so the calculator adds them to net profit and subtracts them from the break-even price. Ignoring dividends understates returns on income stocks by a few percent a year.
What the calculator does not do: project future dividends, apply qualified-versus-ordinary dividend tax rates, or model dividend reinvestment compounding. Enter only dividends already received (or firmly expected) for a realized-trade figure. For projecting reinvested savings growth, the savings calculator is the better tool.
Common Mistakes
The biggest mistake is comparing buy and sell prices and calling the difference profit, ignoring commissions entirely. Even with zero-commission brokers, SEC fees on sells and the bid-ask spread are real costs baked into execution prices.
Second, forgetting that return percentage divides by the full cost basis including the buy commission, not just buy price × shares. Third, annualizing without a holding period, or annualizing a trade held for days into a triple-digit yearly rate and treating it as sustainable. The calculator shows the raw total return alongside the annualized figure so both stay in view.

Frequently asked questions
How do you calculate stock profit?
Net profit = (sell price - buy price) x shares - buy commission - sell commission + dividends. Return percentage = net profit / total cost basis x 100.
What is the break-even sell price?
The per-share price where the trade nets zero after all costs: (buy value + fees - dividends) / shares. Sell above it to profit.
Should I include commissions?
Yes, always. Even small flat commissions change the break-even price and the return percentage, especially on small trades.
Do dividends count as profit?
Cash dividends received during the holding period are part of your total return, so they are added to net profit and lower your break-even price.
What is annualized return?
The yearly-equivalent rate of your total return: (end value / start value)^(365/days) - 1. It lets you compare trades held for different lengths of time.
Is this profit before or after tax?
Before tax. The calculator does not apply capital-gains tax rates, which depend on your income, holding period, and country.
Does it handle short selling?
No. This calculator models a long position: buy first, then sell. Short positions reverse the profit formula.