CAGR Calculator: Measure True Annualized Investment Growth
Investment returns bounce around year to year — CAGR smooths them into a single annual rate. Enter the starting value, ending value and number of years, and this free CAGR calculator will reveal the true compound annual growth rate behind any investment.
Formulas verified against standard references. Calculator logic tested with verified worked examples. Last reviewed: October 2026. Our methodology
How CAGR is calculated
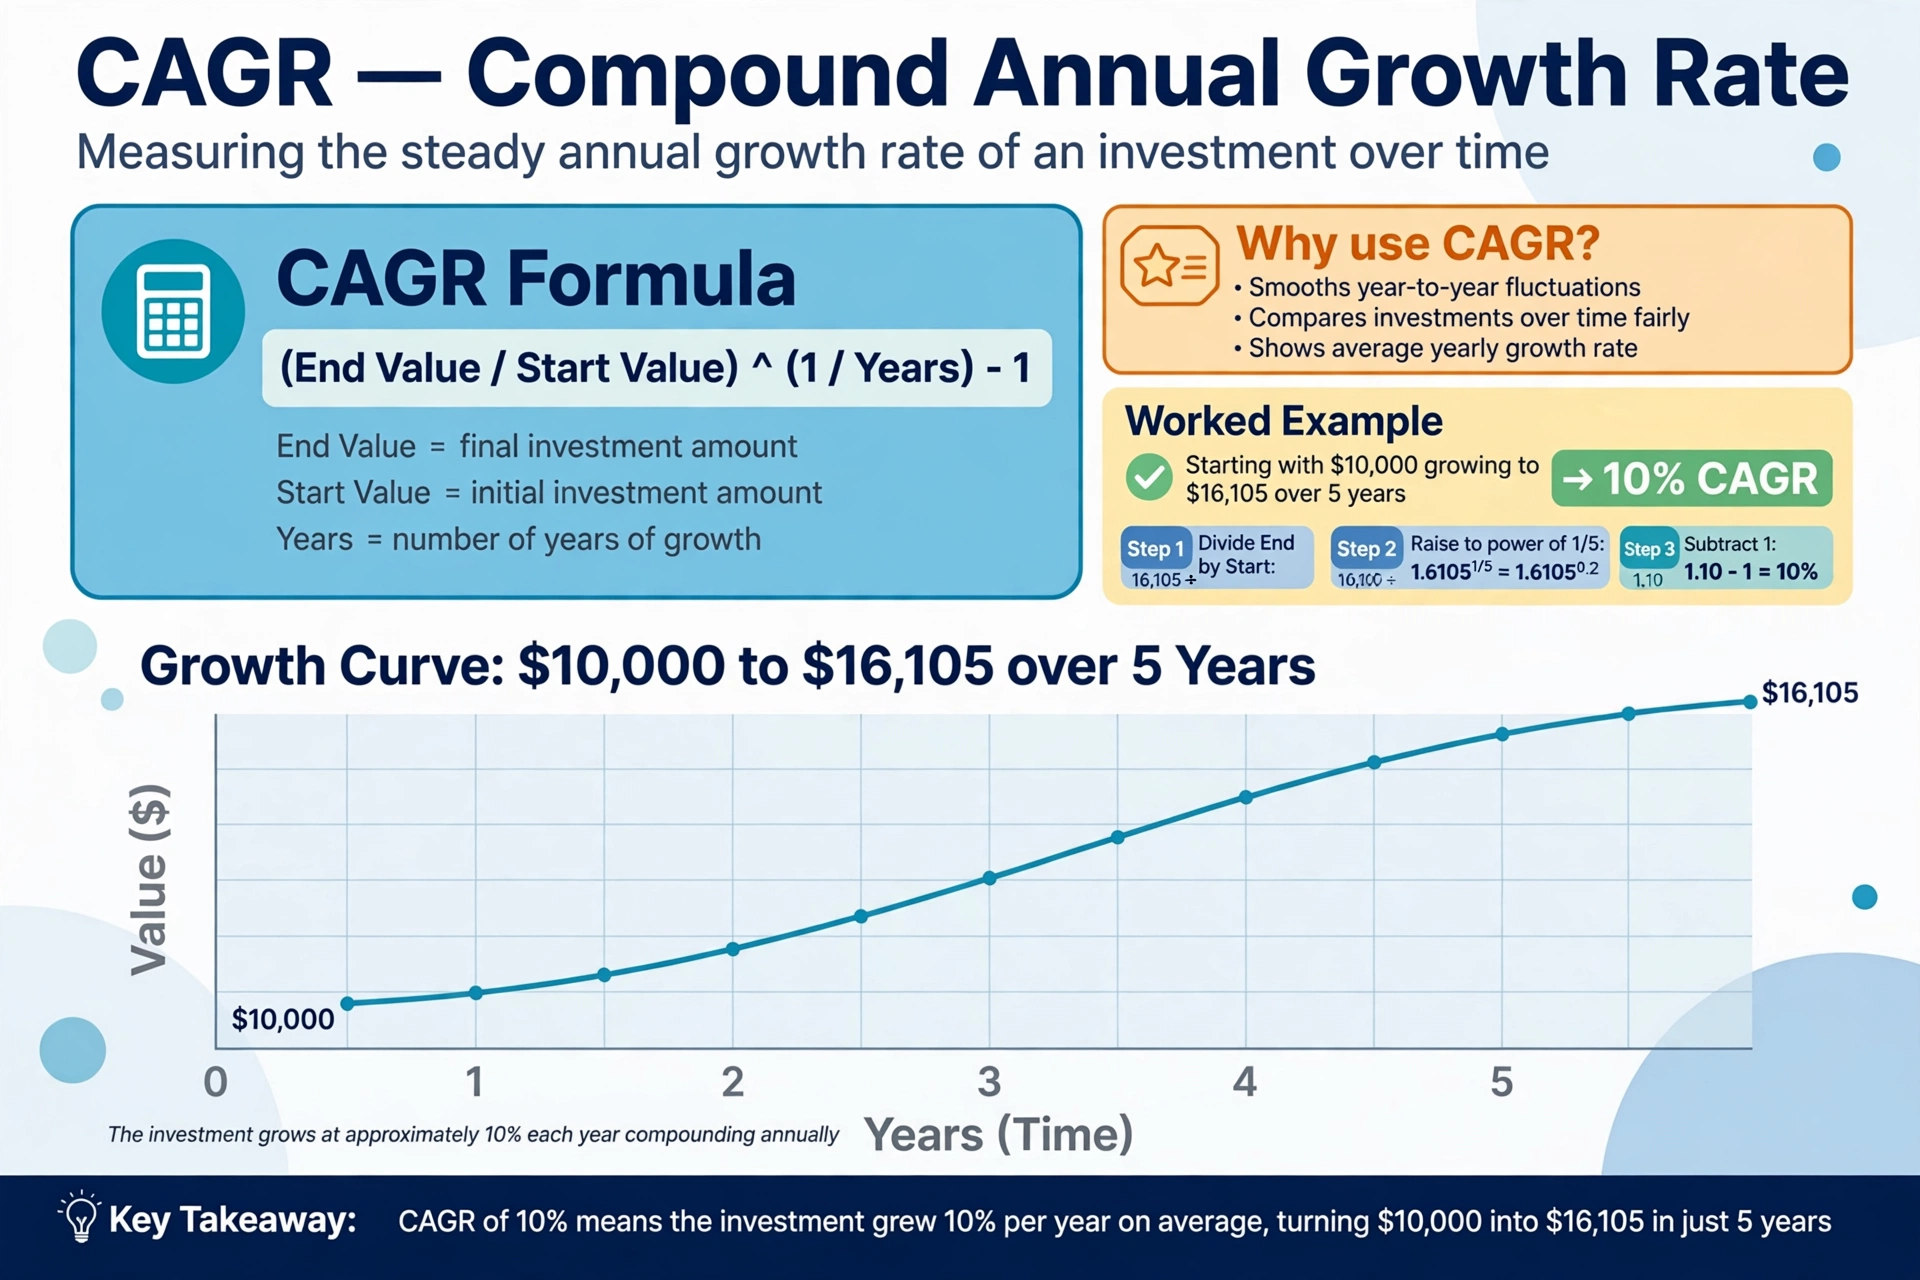
CAGR (compound annual growth rate) is the constant yearly rate that would grow the start value into the end value:
- CAGR = (ending ÷ starting)(1 ÷ years) − 1 — the geometric mean of annual growth.
- Total growth = (ending − starting) ÷ starting × 100 — the raw percentage gain, ignoring time.
- CAGR vs. average return: averaging +50% and −50% gives 0%, but the money actually fell 25% — CAGR reports the honest −13.4%.
| $10,000 over 5 years grows to… | Total growth | CAGR |
|---|---|---|
| $12,500 | 25% | 4.56% |
| $16,105 | 61.05% | 10.00% |
| $20,000 | 100% | 14.87% |
Doubling in 5 years is not "20% per year" — it is 14.87%, because compounding does part of the work. CAGR is the only fair way to compare investments held for different lengths of time.
Worked example
An investment grows from $10,000 to $16,105.10 over 5 years. CAGR = (16,105.10 ÷ 10,000)(1 ÷ 5) − 1.
Divide: 1.61051. Raise to the 0.2 power: 1.610510.2 = 1.10. Subtract 1: 0.10 = 10.00%. Total growth: (16,105.10 − 10,000) ÷ 10,000 = 61.05% — the same gain expressed without the time dimension.
How to use the CAGR calculator
Use values from the same basis — both market values, both inflation-adjusted, or both nominal — or the rate mixes meanings.
Step by step
- Enter the starting value. What the investment was worth at the beginning.
- Enter the ending value. What it is worth now (or at sale).
- Enter the number of years. Decimals work for partial years: 2.5 for two and a half.
- Press Calculate. Read the CAGR and the total growth side by side.
CAGR vs. average annual return: why the average lies
The most common investing math mistake is averaging yearly percentages:
| Year | Return | $10,000 becomes |
|---|---|---|
| 1 | +50% | $15,000 |
| 2 | −50% | $7,500 |
The "average return" is (+50 − 50) ÷ 2 = 0% — yet you lost $2,500. The CAGR is (7,500 ÷ 10,000)½ − 1 = −13.4%, the true yearly rate. Volatility drags geometric growth below the arithmetic average, always. Whenever someone quotes an "average return", ask whether it is CAGR — if not, it flatters the investment.
What is a good CAGR?
Context is everything — a number is only "good" against its benchmark:
| Investment | Typical long-run CAGR |
|---|---|
| US large-cap stocks | ~10% nominal, ~7% real |
| Bonds | ~4–5% nominal |
| High-yield savings | ~2–4% nominal |
| Inflation (US) | ~3% |
A 6% CAGR beats inflation comfortably but trails stocks; a 12% CAGR over a decade puts a fund in elite company. Compare like with like — your stock portfolio against a stock index, over the same years — and remember past CAGR never promises future results. To project a CAGR forward, a future value calculator grows any starting amount at the rate you choose.
CAGR limitations: what it hides
CAGR's smoothness is also its blind spot:
- It hides volatility. A steady 10% yearly and a wild +40%/−15% ride can share the same CAGR — the lived experience differs enormously.
- It ignores cash flows. Money added or withdrawn mid-period breaks the formula; use XIRR (internal rate of return) for portfolios with deposits.
- Endpoints dominate. Starting just before a crash or ending at a peak skews the rate — check multiple windows.
- It is backward-looking. A 15% historical CAGR is a fact about the past, not a forecast.
Use CAGR to compare completed investments fairly — then look at volatility and drawdowns before deciding what to buy next.

Frequently asked questions
How do you calculate CAGR?
CAGR = (ending value ÷ starting value)^(1 ÷ years) − 1. For $10,000 growing to $16,105.10 over 5 years: 1.61051^0.2 − 1 = 10.00%.
What is a good CAGR for investments?
US stocks average ~10% nominal (~7% after inflation) long-term; bonds ~4–5%; savings ~2–4%. Judge any CAGR against its benchmark over the same period, not in isolation.
CAGR vs. average return: which is right?
CAGR. Averaging +50% and −50% gives 0%, but the money actually fell 25% (CAGR −13.4%). Volatility always drags geometric growth below the arithmetic average.
Can CAGR be negative?
Yes — when the ending value is below the starting value. A $10,000 investment falling to $7,500 over 2 years has a CAGR of −13.4%.
Does CAGR account for deposits and withdrawals?
No — it assumes a single starting amount untouched until the end. For portfolios with cash flows in or out, use XIRR (internal rate of return) instead.
Why does doubling in 5 years not equal 20% per year?
Because compounding helps: (2)^(1/5) − 1 = 14.87%. The growth earns its own growth, so a lower steady rate still doubles the money.
How is CAGR different from total growth?
Total growth is the raw gain (61.05% for $10k → $16.1k); CAGR annualizes it (10.00% per year for 5 years). Total growth ignores time; CAGR makes different holding periods comparable.